Unlock a world of possibilities! Login now and discover the exclusive benefits awaiting you.
- Qlik Community
- :
- All Forums
- :
- QlikView App Dev
- :
- Re: Create a chart with both overall and breakdown...
- Subscribe to RSS Feed
- Mark Topic as New
- Mark Topic as Read
- Float this Topic for Current User
- Bookmark
- Subscribe
- Mute
- Printer Friendly Page
- Mark as New
- Bookmark
- Subscribe
- Mute
- Subscribe to RSS Feed
- Permalink
- Report Inappropriate Content
Create a chart with both overall and breakdown plots
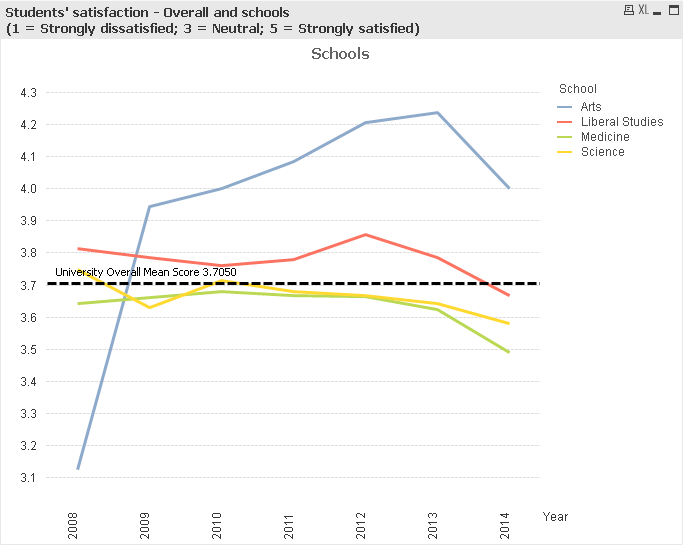
I have a set of survey data which asked students to gave 5-point satisfaction ratings to different aspects (i.e. aspect 1, aspect 2, ...etc) of a university. All students are affiliated to one school (e.g. Arts, Liberal Studies, ... etc). To illustrate the situation, I create a sample qlikview file (a simplified version, just show a few years, schools and one aspect).
I am able to show the mean score, break down by years and schools. What I want is to add a plot for overall mean score (i.e. university overall mean score) in the same graph and this line plot should NOT change even users select one or multiple values in the "school" listbox.
I tried to add a new expression "=avg( {1} aspect1)" and though it did give me the plot for university level results, the chart no longer showed individual school results.
I know one way of doing this is to remove "school" from the dimension in the chart and then add individual expression for each school and also one expression for university. However this is not quite feasible as the university involves quite a number of schools and their names do changes occasionally in different years. It will require much update efforts if I "hardcode" those schools in expressions.
Any ideas on how to add this average plot is much appreciated.
- Tags:
- new_to_qlikview
- Mark as New
- Bookmark
- Subscribe
- Mute
- Subscribe to RSS Feed
- Permalink
- Report Inappropriate Content
Hi Horry
You need to move School dimensions on the expression level.
Check an example
- Mark as New
- Bookmark
- Subscribe
- Mute
- Subscribe to RSS Feed
- Permalink
- Report Inappropriate Content
Hi Horry,
As far as I'm aware Qlikview won't allow you to do this in a line graph - you are trying to mix granularities.
Would adding a reference line for the university overall mean score work in this instance? You can use formula "avg(All Aspect1)" to disregard any selections.
Regards
Chris
- Mark as New
- Bookmark
- Subscribe
- Mute
- Subscribe to RSS Feed
- Permalink
- Report Inappropriate Content
- Mark as New
- Bookmark
- Subscribe
- Mute
- Subscribe to RSS Feed
- Permalink
- Report Inappropriate Content
Thanks for your reply.
I knew this work and actually I used this method before. But that is also what I try to avoid now - this requires much efforts in adding each school in the expression level. We got about 10 schools and much more number of questions. In case there is any change on the school names in the future, we need to update the expression one by one, which is time-consuming.
- Mark as New
- Bookmark
- Subscribe
- Mute
- Subscribe to RSS Feed
- Permalink
- Report Inappropriate Content
Thanks for your input.
This gives an average score of all students across all years (and that's why it is a straight horizontal line) but I prefer showing the mean score break down by years.