Unlock a world of possibilities! Login now and discover the exclusive benefits awaiting you.
- Qlik Community
- :
- All Forums
- :
- QlikView App Dev
- :
- Re: Create buttons with Actions
- Subscribe to RSS Feed
- Mark Topic as New
- Mark Topic as Read
- Float this Topic for Current User
- Bookmark
- Subscribe
- Mute
- Printer Friendly Page
- Mark as New
- Bookmark
- Subscribe
- Mute
- Subscribe to RSS Feed
- Permalink
- Report Inappropriate Content
Create buttons with Actions
Hi Experts - For the attached chart.. i need to have 3 buttons.. say "0%-10%" ; "11%-20%",">20%"... When i click the "0%-10%" button... %'s belonging to those shuld reflect in my chart (chk attached qvw).. like wise for other buttons as well..
- « Previous Replies
- Next Replies »
- Mark as New
- Bookmark
- Subscribe
- Mute
- Subscribe to RSS Feed
- Permalink
- Report Inappropriate Content
Hi Sunny - I have created a sample DB which is almost close to my original DB..
Please select Year_Name as 2003 and Month_Name as May
Note: - "0-70" & "70-85" buttons have normal Actions which are created by me earlier... Other 2 buttons have actions which u have provided last time
Issue i face are,
-> After the above mentioned selections when i toggle from "0-70" onward.. i see data perfectly till i reach "85-200" button
-> After above mentioned selections, first when you click on ">200".. it displays "No Data" which is perfect.. later when you try clicking "0-70" or other buttons... u can notice those default selections getting disappeared in "Current selection box"
Attached file FYR..
- Mark as New
- Bookmark
- Subscribe
- Mute
- Subscribe to RSS Feed
- Permalink
- Report Inappropriate Content
Well, I see what the issue is, but this is how QlikView is... anyways the solution is possible, but not sure if this is something you would like or not... Try this script
Fact:
LOAD * INLINE [
Year_Name, Month_Name, PL, Actual, Target
2001, Jan, AAA, 3, 10
2001, Jan, BBB, 8, 10
2001, Jan, CCC, 9, 10
2001, Feb, AAA, 3, 10
2001, Feb, BBB, 8, 10
2001, Feb, CCC, 9, 10
2001, Mar, AAA, 3, 10
2001, Mar, BBB, 8, 10
2001, Mar, CCC, 9, 10
2001, Apr, AAA, 3, 10
2001, Apr, BBB, 8, 10
2001, Apr, CCC, 9, 10
2001, May, AAA, 3, 10
2001, May, BBB, 8, 10
2001, May, CCC, 9, 10
2002, Jan, AAA, 16, 20
2002, Jan, BBB, 6, 20
2002, Jan, CCC, 18, 20
2002, Feb, AAA, 16, 20
2002, Feb, BBB, 6, 20
2002, Feb, CCC, 18, 20
2002, Mar, AAA, 16, 20
2002, Mar, BBB, 6, 20
2002, Mar, CCC, 18, 20
2002, Apr, AAA, 16, 20
2002, Apr, BBB, 6, 20
2002, Apr, CCC, 18, 20
2002, May, AAA, 16, 20
2002, May, BBB, 6, 20
2002, May, CCC, 18, 20
2003, Jan, AAA, 27, 30
2003, Jan, BBB, 9, 30
2003, Jan, CCC, 24, 30
2003, Feb, AAA, 27, 30
2003, Feb, BBB, 9, 30
2003, Feb, CCC, 24, 30
2003, Mar, AAA, 27, 30
2003, Mar, BBB, 9, 30
2003, Mar, CCC, 24, 30
2003, Apr, AAA, 27, 30
2003, Apr, BBB, 9, 30
2003, Apr, CCC, 24, 30
2003, May, AAA, 27, 30
2003, May, BBB, 9, 30
2003, May, CCC, 24, 30
];
Concatenate(Fact)
LOAD DISTINCT
Year_Name,
Month_Name,
'Null' as PL
Resident Fact;
Basically you need to have a null PL for every combination of your other dimensions in the fact table in order for you to be able to keep all the selections when you go to null. Otherwise they get unselected when you go to null and it would be programmatically difficult (not impossible) to bring back those selections. But if you make the change in the script... it would be rather simple to do it. Check attached
- Mark as New
- Bookmark
- Subscribe
- Mute
- Subscribe to RSS Feed
- Permalink
- Report Inappropriate Content
Ok.. In this also i see the same issue..
After selecting Year_Name as 2003 and Month_Name as May...
Initially i selected ">200" and i see no data.. That's working fine... Later when i try clicking "85-200", i see still "No data" 
Expected result:
- Mark as New
- Bookmark
- Subscribe
- Mute
- Subscribe to RSS Feed
- Permalink
- Report Inappropriate Content
Do you expect to see data for 85-200? I am not seeing the data with that selection also... Not sure if you have data for the range or not
- Mark as New
- Bookmark
- Subscribe
- Mute
- Subscribe to RSS Feed
- Permalink
- Report Inappropriate Content
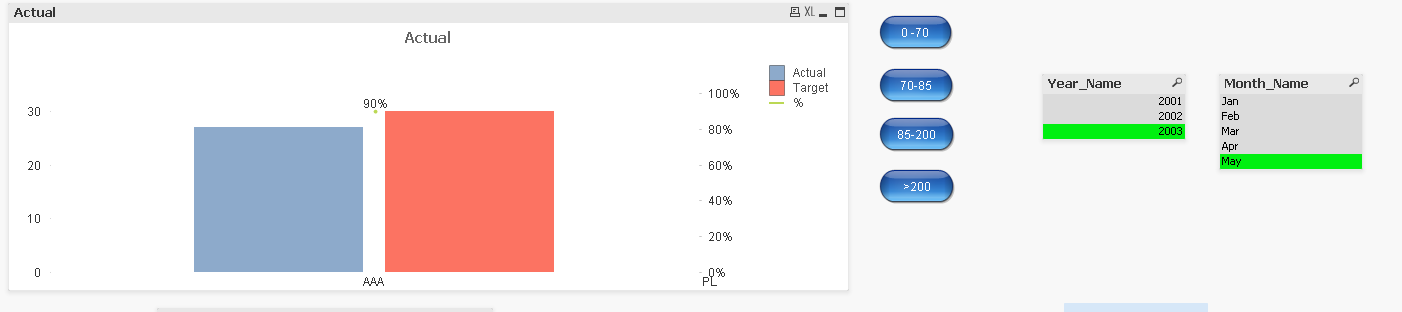
Yes we do have data... if you see the attached screen shot.. we have data which falls between "85-200" after selecting Year_Name as 2003 and Month Name as May

- Mark as New
- Bookmark
- Subscribe
- Mute
- Subscribe to RSS Feed
- Permalink
- Report Inappropriate Content
The app that is attached for me, doesn't seem to have anything for 85-200...

- Mark as New
- Bookmark
- Subscribe
- Mute
- Subscribe to RSS Feed
- Permalink
- Report Inappropriate Content
Ok I have attached the app again..
if you see . we have data which falls between "85-200" (Press that button) after selecting Year_Name as 2003 and Month Name as May...
But with the same filter selection(Year_Name as 2003 and Month Name as May...) .. If we click ">200" first and later "85-200" then we see as No values..
- Mark as New
- Bookmark
- Subscribe
- Mute
- Subscribe to RSS Feed
- Permalink
- Report Inappropriate Content
Change the action to this (ignore selection in PL)
=If(Len(Trim(Concat(DISTINCT {<PL = {"=sum({<PL>}Actual)/sum({<PL>}Target) > 0.85 and sum({<PL>}Actual)/sum({<PL>}Target) <= 2.00"}>} Chr(34) & PL & Chr(34), '|'))) > 0,
'=sum({<PL>}Actual)/sum({<PL>}Target) > 0.85 and sum({<PL>}Actual)/sum({<PL>}Target) <= 2.00', 'null')
- Mark as New
- Bookmark
- Subscribe
- Mute
- Subscribe to RSS Feed
- Permalink
- Report Inappropriate Content
Worked Perfectly!!! Thank u stalwar1 !! 
- Mark as New
- Bookmark
- Subscribe
- Mute
- Subscribe to RSS Feed
- Permalink
- Report Inappropriate Content
I am glad it did
- « Previous Replies
- Next Replies »