Unlock a world of possibilities! Login now and discover the exclusive benefits awaiting you.
- Qlik Community
- :
- All Forums
- :
- QlikView App Dev
- :
- Creating Stack Chart in QV
- Subscribe to RSS Feed
- Mark Topic as New
- Mark Topic as Read
- Float this Topic for Current User
- Bookmark
- Subscribe
- Mute
- Printer Friendly Page
- Mark as New
- Bookmark
- Subscribe
- Mute
- Subscribe to RSS Feed
- Permalink
- Report Inappropriate Content
Creating Stack Chart in QV
Hello,
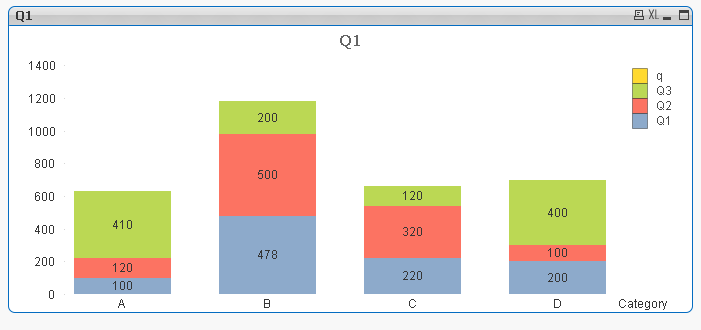
I am looking to creating a stacked bar chart in the attached format. In my attached example, values for Q1, Q2, Q3, and Q4 are calculated.
Thank You in advance!!
Accepted Solutions
- Mark as New
- Bookmark
- Subscribe
- Mute
- Subscribe to RSS Feed
- Permalink
- Report Inappropriate Content
Hi,
You just need to load your data with CrossTable, then create the Bart chart
Dimension : Quarter and Category
Expression : Sum(Data)
Goto style tab -> check the Stacked option.
That's it.
Check the Attachment..
- Mark as New
- Bookmark
- Subscribe
- Mute
- Subscribe to RSS Feed
- Permalink
- Report Inappropriate Content
create bar chart with dim category and expression will be
1)sum(Q1)
2)sum(Q2)
3)sum(Q3)
4)sum(Q4)
on expression tab keep values on data point check box on values on data point .
on presentation tab keep values inside segment check box on.
on style tab make subtype as stacked.
thats it...
- Mark as New
- Bookmark
- Subscribe
- Mute
- Subscribe to RSS Feed
- Permalink
- Report Inappropriate Content
Thanks much for your help!