Unlock a world of possibilities! Login now and discover the exclusive benefits awaiting you.
- Qlik Community
- :
- All Forums
- :
- QlikView App Dev
- :
- Creating a Light Graph with dates expressions
- Subscribe to RSS Feed
- Mark Topic as New
- Mark Topic as Read
- Float this Topic for Current User
- Bookmark
- Subscribe
- Mute
- Printer Friendly Page
- Mark as New
- Bookmark
- Subscribe
- Mute
- Subscribe to RSS Feed
- Permalink
- Report Inappropriate Content
Creating a Light Graph with dates expressions
Hello eveyone,
I am working on a project where i need create a semaphore graph which alternate the color depending on the results of the conditions below:
1) If the "Expected Date" minus today's date is less than 3 months, the light should be green;
2) If the "Expected Date" minus today's date is greater than 3 monhts, the light should be yellow;
3) If the "Expected Date" minus today's date is greter than today's date, the light should be red;
"Expected Date" is a date field from my database (i.e 18/03/2018);
I'm not sure if I can do subtraction operations using dates on QlikView.
How should be my expression to make this works on QlikView?
Regards,
Accepted Solutions
- Mark as New
- Bookmark
- Subscribe
- Mute
- Subscribe to RSS Feed
- Permalink
- Report Inappropriate Content
Rodrigo, I assume you are using a traffic light gauge in a chart.
If so, maybe let the expression return numbers instead of color codes
=If( [Expected Date]- Today() <90, 1, If([Expected Date] <Today() , 3,2 )
Then set min and max to e.g. 0 and 3.
Disable autowidth segments and set lower bound to e.g. 0,2 and 3 for each segment.
- Mark as New
- Bookmark
- Subscribe
- Mute
- Subscribe to RSS Feed
- Permalink
- Report Inappropriate Content
Dates are dual (meaning they are both text and number) so you can perform subtraction on dates.
If(AddMonths(Today(), -3) - [Expected Date] < 0, Green(),
If(AddMonths(Today(), -3) - [Expected Date] > 0 and Today() > [Expected Date], Yellow(), Red()))
- Mark as New
- Bookmark
- Subscribe
- Mute
- Subscribe to RSS Feed
- Permalink
- Report Inappropriate Content
SET DateFormat = 'DD/MM/YYYY';
Then you should be able to just subtract dates, like
=If( [Expected Date]- Today() <90, Yellow() )
- Mark as New
- Bookmark
- Subscribe
- Mute
- Subscribe to RSS Feed
- Permalink
- Report Inappropriate Content
The graph is asking for a Minimum and Max values, what should be added into this propertie?
Thanks
- Mark as New
- Bookmark
- Subscribe
- Mute
- Subscribe to RSS Feed
- Permalink
- Report Inappropriate Content
Which chart are you working with?
- Mark as New
- Bookmark
- Subscribe
- Mute
- Subscribe to RSS Feed
- Permalink
- Report Inappropriate Content
Rodrigo, I assume you are using a traffic light gauge in a chart.
If so, maybe let the expression return numbers instead of color codes
=If( [Expected Date]- Today() <90, 1, If([Expected Date] <Today() , 3,2 )
Then set min and max to e.g. 0 and 3.
Disable autowidth segments and set lower bound to e.g. 0,2 and 3 for each segment.
- Mark as New
- Bookmark
- Subscribe
- Mute
- Subscribe to RSS Feed
- Permalink
- Report Inappropriate Content
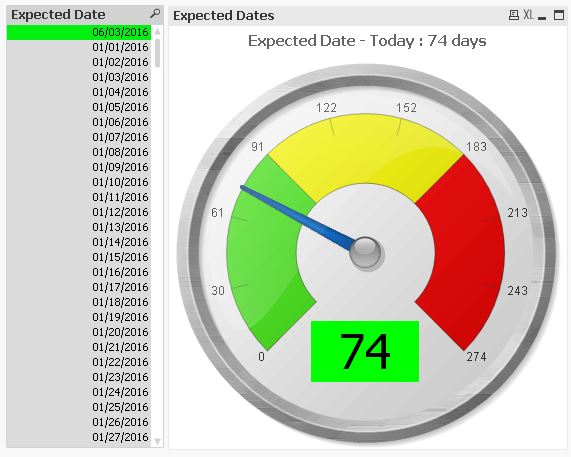
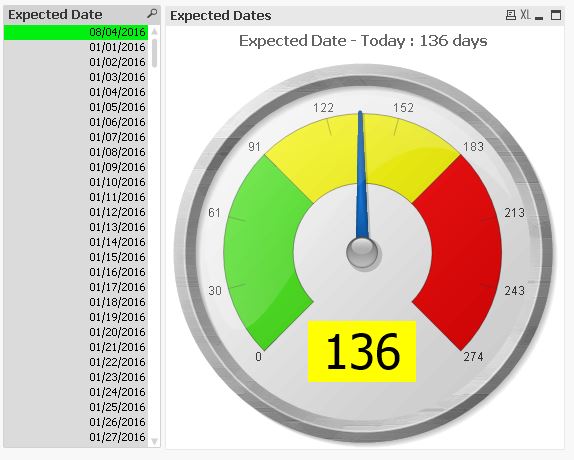
Im working with this chart:

- Mark as New
- Bookmark
- Subscribe
- Mute
- Subscribe to RSS Feed
- Permalink
- Report Inappropriate Content
Hi,
maybe something like this:
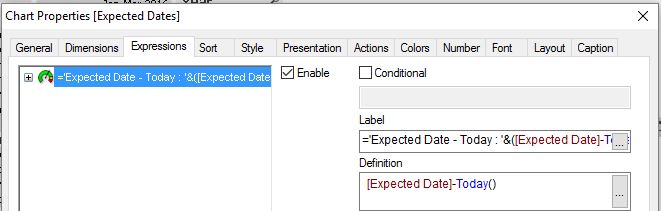
hope this helps
regards
Marco
- Mark as New
- Bookmark
- Subscribe
- Mute
- Subscribe to RSS Feed
- Permalink
- Report Inappropriate Content
Hi swuehl,
Thanks for your tip, with that expression the traffic light is working well.
One more question: How can i turn the light to grey when no filters are applied (E.G when the user click in Clear All filters)?
Thanks,