Unlock a world of possibilities! Login now and discover the exclusive benefits awaiting you.
- Qlik Community
- :
- All Forums
- :
- QlikView App Dev
- :
- Creating a line chart with dots like in Excel
Options
- Subscribe to RSS Feed
- Mark Topic as New
- Mark Topic as Read
- Float this Topic for Current User
- Bookmark
- Subscribe
- Mute
- Printer Friendly Page
Turn on suggestions
Auto-suggest helps you quickly narrow down your search results by suggesting possible matches as you type.
Showing results for
Not applicable
2015-07-23
10:05 AM
- Mark as New
- Bookmark
- Subscribe
- Mute
- Subscribe to RSS Feed
- Permalink
- Report Inappropriate Content
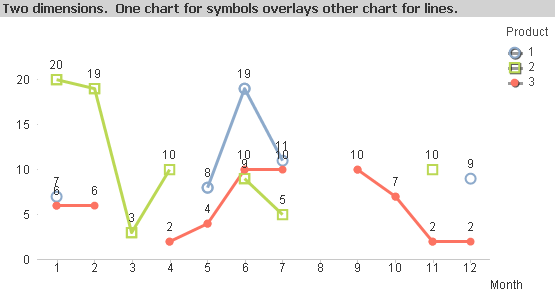
Creating a line chart with dots like in Excel
Hi everyone,
I would like to create a line chart with dots, like in this example posted by John Witherspoon :
https://community.qlik.com/thread/32430
But I don't know how to do it, I went to "Expressions > Line Style" and tried <Sn> and <Wn> but that's not it. Even John didn't touch this option.
Thanks for you help,
423 Views
1 Solution
Accepted Solutions
Creator III
2015-07-23
10:16 AM
- Mark as New
- Bookmark
- Subscribe
- Mute
- Subscribe to RSS Feed
- Permalink
- Report Inappropriate Content
322 Views
1 Reply
Creator III
2015-07-23
10:16 AM
- Mark as New
- Bookmark
- Subscribe
- Mute
- Subscribe to RSS Feed
- Permalink
- Report Inappropriate Content
In the expression editor of the line chart...check symbol.

Azam
323 Views