Unlock a world of possibilities! Login now and discover the exclusive benefits awaiting you.
- Qlik Community
- :
- All Forums
- :
- QlikView App Dev
- :
- Creating a multilayered graph with conditional set...
- Subscribe to RSS Feed
- Mark Topic as New
- Mark Topic as Read
- Float this Topic for Current User
- Bookmark
- Subscribe
- Mute
- Printer Friendly Page
- Mark as New
- Bookmark
- Subscribe
- Mute
- Subscribe to RSS Feed
- Permalink
- Report Inappropriate Content
Creating a multilayered graph with conditional settings
Hello again,
Still very new to QlikView and to SetAnalysis, and need help again creating a stacked graph. I have attached a file with the columns in question. Any help is greatly appreciated.
What I want is
1. Only "Southeast" REGION data [I figure I'll use set analysis to limit data to "Southeast" region, but not sure where to do this or how]
2. Only results of value "5" for all Questions (Q2, Q15, and Q16) [Not sure if I use set analysis or conditional expression]
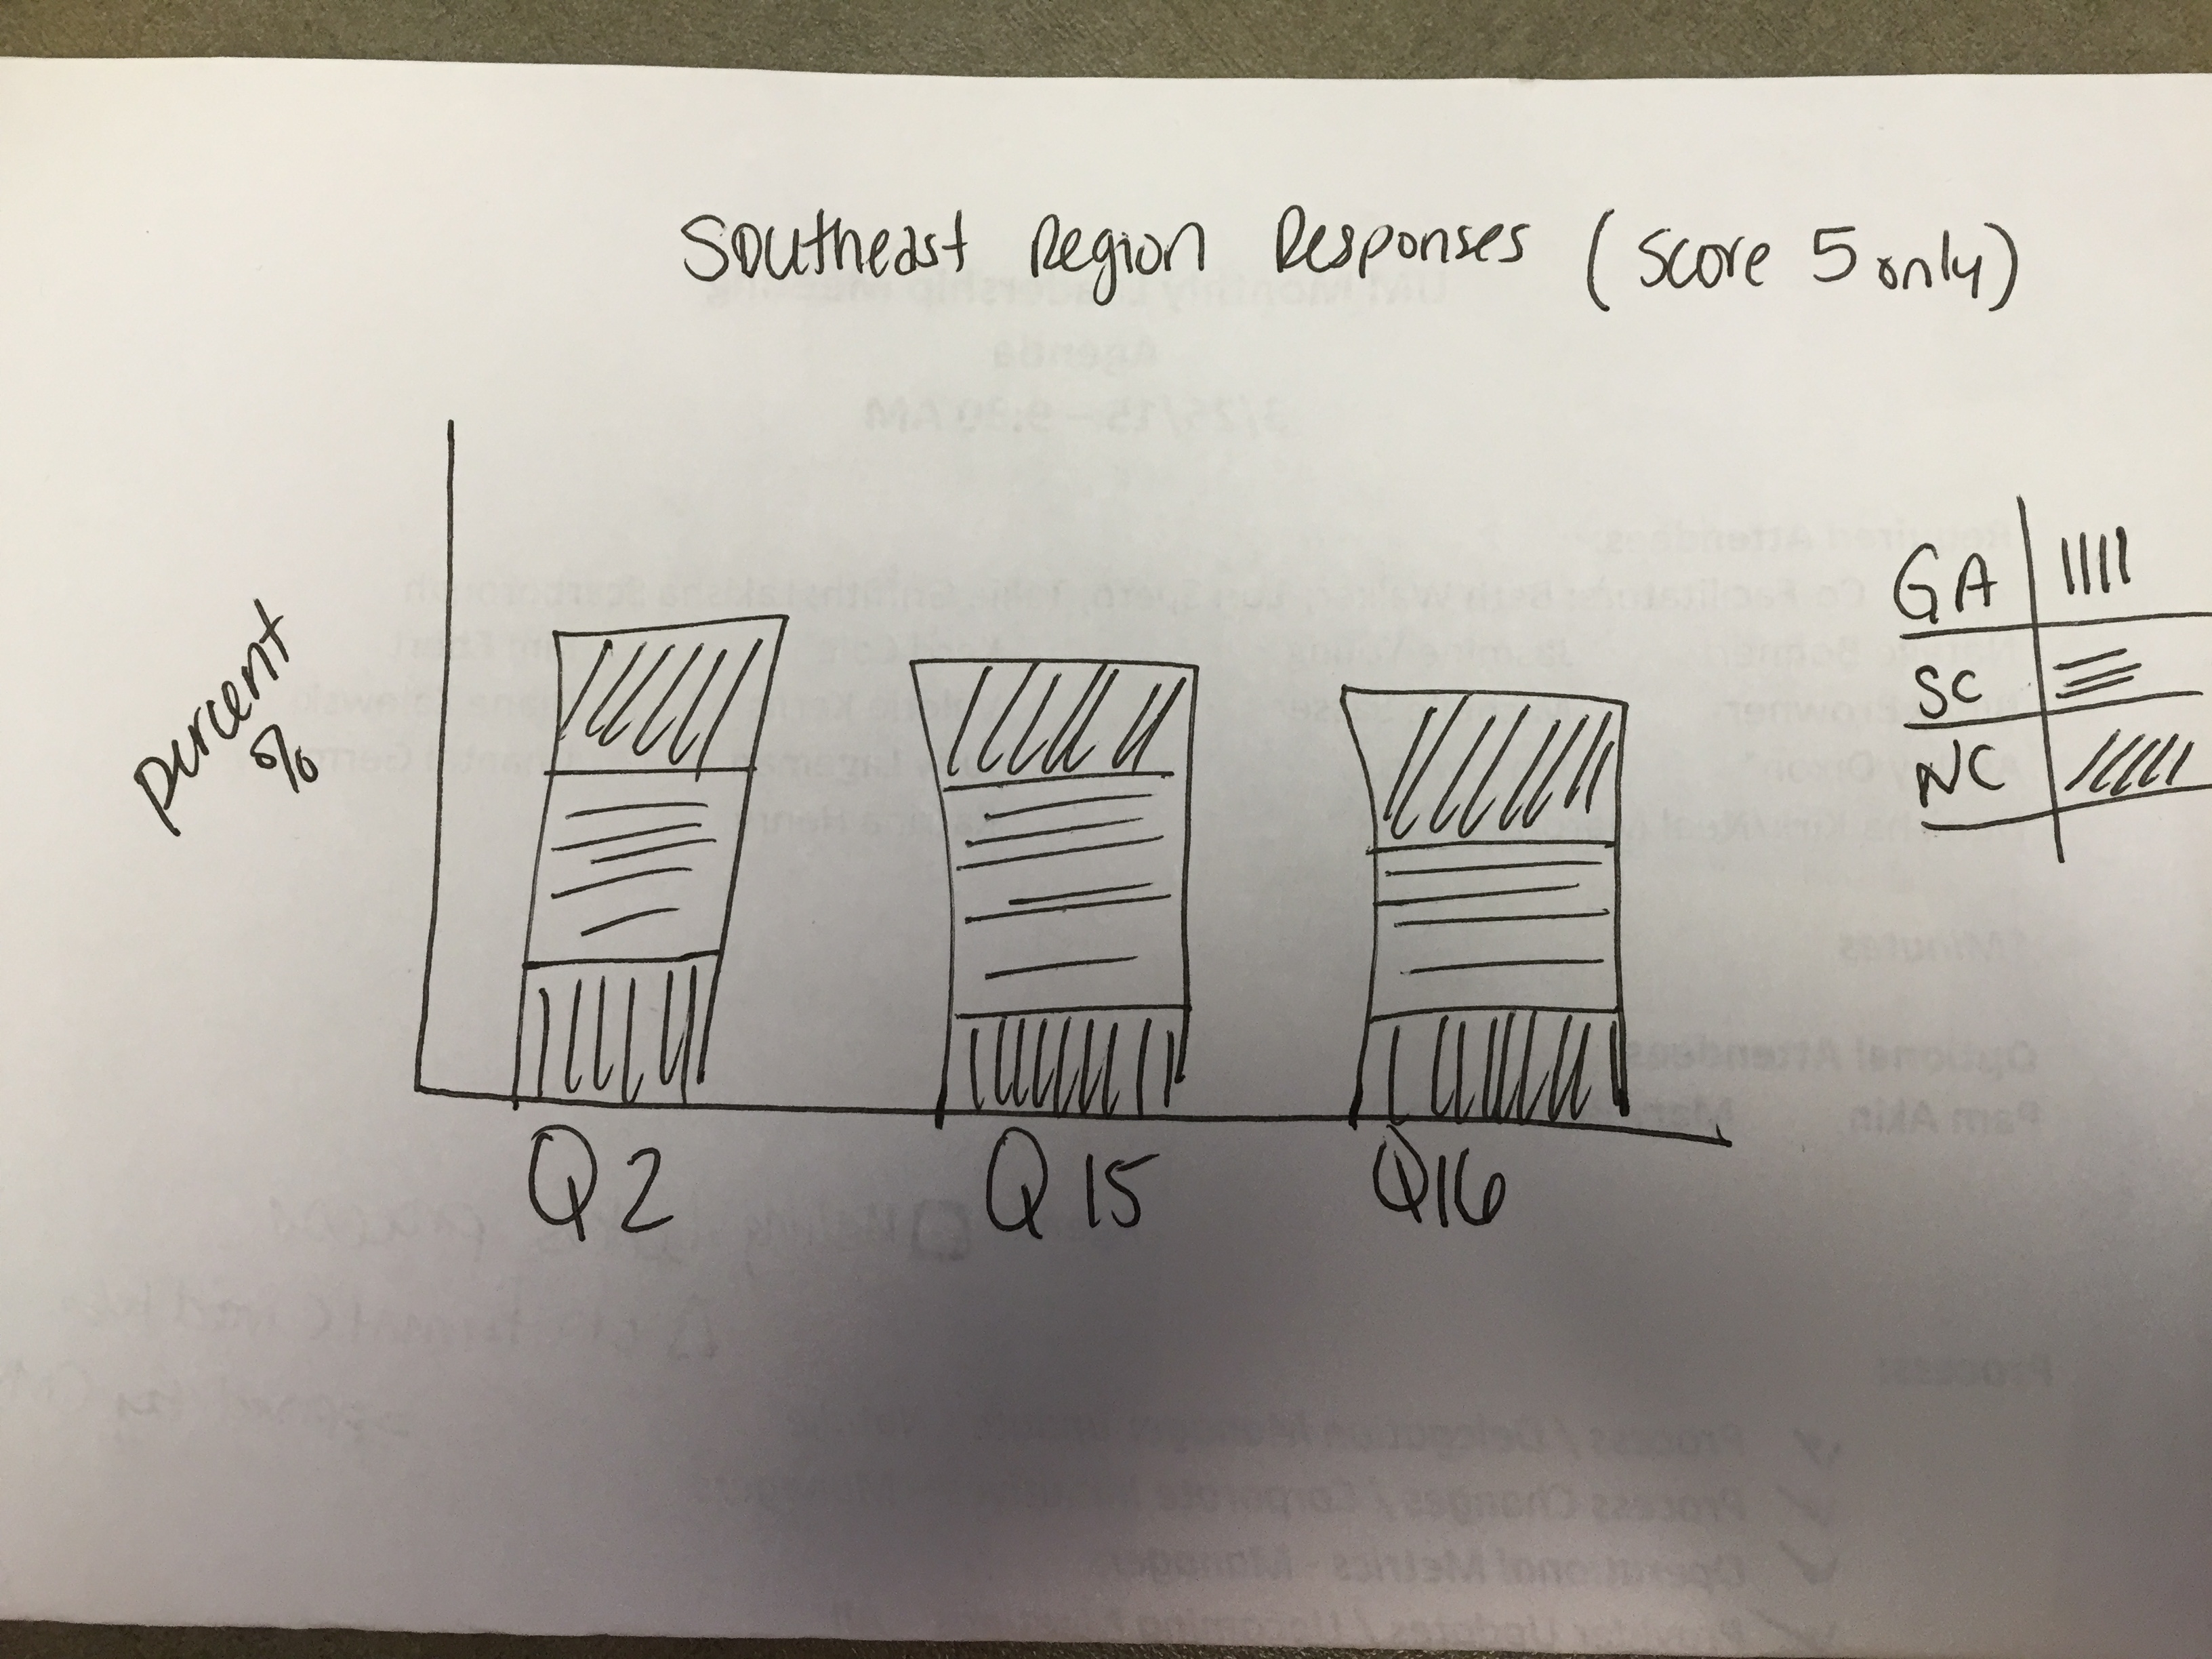
3. the X-axis to be the Questions [I assume I have each question be an expression]
4. a stacked graph with C_State (GA, SC, NC).
In the end, I want a graph that looks like this:
- Mark as New
- Bookmark
- Subscribe
- Mute
- Subscribe to RSS Feed
- Permalink
- Report Inappropriate Content
Yes Karen, you would require to do set Analysis, to filter out your result.In order to get selected states in rthe dimension, you can create a new dimension using if condition.
Regards
S