Unlock a world of possibilities! Login now and discover the exclusive benefits awaiting you.
- Qlik Community
- :
- All Forums
- :
- QlikView App Dev
- :
- Re: Creating a stacked bar chart
- Subscribe to RSS Feed
- Mark Topic as New
- Mark Topic as Read
- Float this Topic for Current User
- Bookmark
- Subscribe
- Mute
- Printer Friendly Page
- Mark as New
- Bookmark
- Subscribe
- Mute
- Subscribe to RSS Feed
- Permalink
- Report Inappropriate Content
Creating a stacked bar chart
I have survey responses such as the following:
Rank your top 3
| Response ID | B | C | D |
|---|---|---|---|
| Sales | 3 | 2 | 0 |
| IT | 3 | 1 | 2 |
| Finance | 1 | 3 | 2 |
| Support | 2 | 0 | 1 |
I want to create a stacked bar chart which will have the ranks 1,2,3 along the x axis and the count of response IDs. with B,C,D identified by colours and as the legend.
Can you help?
Thanks in advance
- Mark as New
- Bookmark
- Subscribe
- Mute
- Subscribe to RSS Feed
- Permalink
- Report Inappropriate Content
Like this?
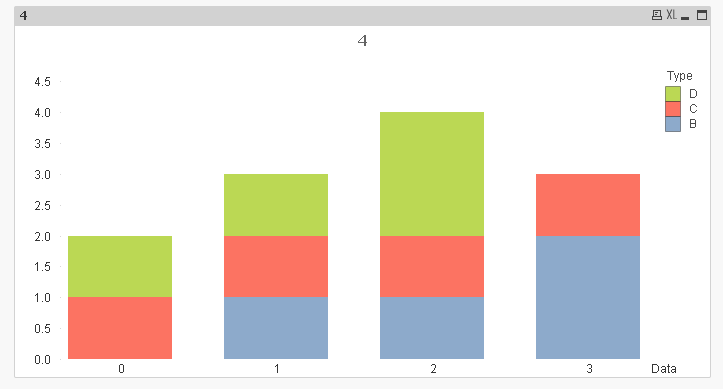
Where i used a crosstable load to transform the data in the script
Table:
CrossTable(Type, Data)
LOAD [Response ID],
B,
C,
D
FROM
[https://community.qlik.com/thread/243322]
(html, codepage is 1252, embedded labels, table is @1);
- Mark as New
- Bookmark
- Subscribe
- Mute
- Subscribe to RSS Feed
- Permalink
- Report Inappropriate Content
Thanks Sunny!
Is there any way to do this without doing it within the script?
- Mark as New
- Bookmark
- Subscribe
- Mute
- Subscribe to RSS Feed
- Permalink
- Report Inappropriate Content
There might be, but why do you really want to complicate your front end? AFAIK Any front end solution will require you to use synthetic dimensions with very complex expressions.
- Mark as New
- Bookmark
- Subscribe
- Mute
- Subscribe to RSS Feed
- Permalink
- Report Inappropriate Content
ok thanks
- Mark as New
- Bookmark
- Subscribe
- Mute
- Subscribe to RSS Feed
- Permalink
- Report Inappropriate Content
Please close the thread by marking the correct answer.