Unlock a world of possibilities! Login now and discover the exclusive benefits awaiting you.
- Qlik Community
- :
- All Forums
- :
- QlikView App Dev
- :
- Re: Creating % analytics
- Subscribe to RSS Feed
- Mark Topic as New
- Mark Topic as Read
- Float this Topic for Current User
- Bookmark
- Subscribe
- Mute
- Printer Friendly Page
- Mark as New
- Bookmark
- Subscribe
- Mute
- Subscribe to RSS Feed
- Permalink
- Report Inappropriate Content
Creating % analytics
Hello,
I have a chart to which I am trying to show a % of products used. However, I've hit a dead end asto how to create this. I currently have the following expression which gives me the total value of the product used:
=num(sum(OKM_POTENTIALVALUE)
I want to then divide this into the total for a specific procedure which the expression is the same. Any ideas on how I can do this?
(The tab in question is the Consumable tab)
(Hope it makes sense)
Accepted Solutions
- Mark as New
- Bookmark
- Subscribe
- Mute
- Subscribe to RSS Feed
- Permalink
- Report Inappropriate Content
Check 'Relative' in the expression tab, check the output, is this what you want?
- Mark as New
- Bookmark
- Subscribe
- Mute
- Subscribe to RSS Feed
- Permalink
- Report Inappropriate Content
Check 'Relative' in the expression tab, check the output, is this what you want?
- Mark as New
- Bookmark
- Subscribe
- Mute
- Subscribe to RSS Feed
- Permalink
- Report Inappropriate Content
Clicked it, doesn't make any change unless I am doing something wrong??
- Mark as New
- Bookmark
- Subscribe
- Mute
- Subscribe to RSS Feed
- Permalink
- Report Inappropriate Content
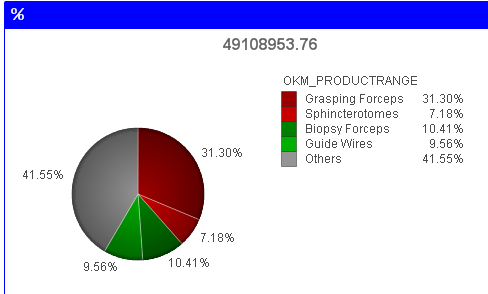
Did you try it in your pie chart? and yes check 'Values on data points' as well, you would notice the change. See how I see:
- Mark as New
- Bookmark
- Subscribe
- Mute
- Subscribe to RSS Feed
- Permalink
- Report Inappropriate Content
Perfect!!!! Something so simple has kept me stuck for days.
Thank you!