Unlock a world of possibilities! Login now and discover the exclusive benefits awaiting you.
- Qlik Community
- :
- All Forums
- :
- QlikView App Dev
- :
- Re: Creating buckets based on week no's
- Subscribe to RSS Feed
- Mark Topic as New
- Mark Topic as Read
- Float this Topic for Current User
- Bookmark
- Subscribe
- Mute
- Printer Friendly Page
- Mark as New
- Bookmark
- Subscribe
- Mute
- Subscribe to RSS Feed
- Permalink
- Report Inappropriate Content
Creating buckets based on week no's
Hi all,
i have a requirement that i'm unsure of how to do it.
Basically i have some data for current and previous year. i want to create buckets with the week commencing dates of the current year as the values but each bucket would be linked to the corresponding week of previous years.
so for example
| W/C Date | Week | Bucket Value// |
|---|---|---|
| 05/01/2015 | 1 | 02/01/2017 |
| 04/01/2016 | 1 | 02/01/2017 |
| 02/01/2017 | 1 | 02/01/2017 |
| 12/01/2015 | 2 | 09/01/2017 |
| 11/01/2016 | 2 | 09/01/2017 |
| 09/01/2017 | 2 | 09/01/2017 |
| etc | ||
| 15/06/2015 | 24 | 12/06/2017 |
| 13/06/2016 | 24 | 12/06/2017 |
| 12/06/2017 | 24 | 12/06/2017 |
| etc |
so i want a bucket for each w/c date of the current year but each bucket would have the corresponding week from previous years too.
i think i only need current and previous, not -2 years, -3 years etc. so currently 2017 and previous 2016
sorry, this is a difficult one to explain!
thanks 
- « Previous Replies
- Next Replies »
Accepted Solutions
- Mark as New
- Bookmark
- Subscribe
- Mute
- Subscribe to RSS Feed
- Permalink
- Report Inappropriate Content
- Mark as New
- Bookmark
- Subscribe
- Mute
- Subscribe to RSS Feed
- Permalink
- Report Inappropriate Content
I think what you need is this
- Mark as New
- Bookmark
- Subscribe
- Mute
- Subscribe to RSS Feed
- Permalink
- Report Inappropriate Content
hmm i dont see how that would work unless i'm missing something.
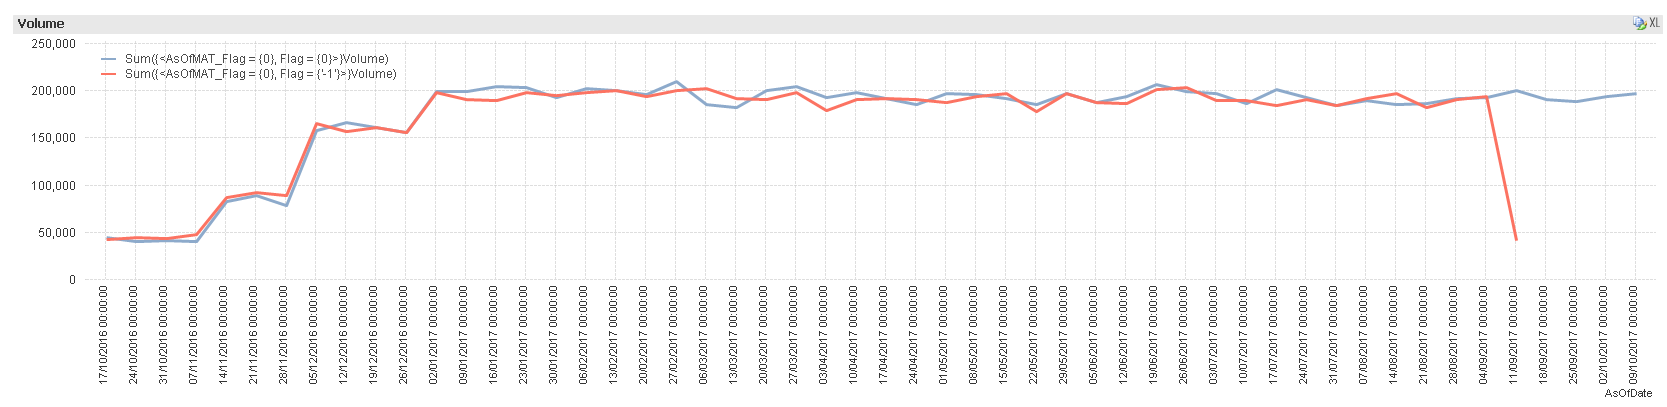
the result i am after is the chart as is in the example i attached but instead of having the week numbers as the x axis i want the current years week commencing dates.
the chart has a line for current year and previous year, the previous year week commencing dates will be a day out to the current year dates, but i want them to fall against the current years dates.
not sure if that makes it more clear?
- Mark as New
- Bookmark
- Subscribe
- Mute
- Subscribe to RSS Feed
- Permalink
- Report Inappropriate Content
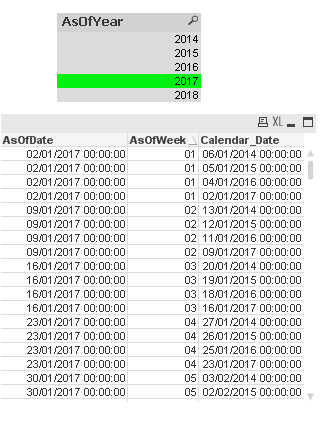
I don't have the files to reload your dashboard... but with as of table you can link this year and current year's week to this years week start date....
- Mark as New
- Bookmark
- Subscribe
- Mute
- Subscribe to RSS Feed
- Permalink
- Report Inappropriate Content
ahh ok, i'll have a go at that now..
- Mark as New
- Bookmark
- Subscribe
- Mute
- Subscribe to RSS Feed
- Permalink
- Report Inappropriate Content
The idea with a very basic example is this
Fact Table
Year Sales
2017 102
2016 120
2015 130
AsOfTable
AsOfYear Year Flag
2017 2017 CY
2017 2016 PY
2016 2016 CY
2016 2015 PY
2015 2015 CY
Now when you use AsOfYear as your dimension instead of Year and use this expression
Sum({<Flag = {'CY'}>}Sales) and Sum({<Flag = {'PY'}>}Sales)
You will see 2017 to show 2017 numbers with first expression and 2016 numbers for the second expression
- Mark as New
- Bookmark
- Subscribe
- Mute
- Subscribe to RSS Feed
- Permalink
- Report Inappropriate Content
I'm confused! its the week numbers and dates that i am struggling to get my head around!
are you able to help?
data attached..
no worries if you're busy, i'll keep trying
- Mark as New
- Bookmark
- Subscribe
- Mute
- Subscribe to RSS Feed
- Permalink
- Report Inappropriate Content
If nobody is able to help by tomorrow... I will try to pick it up again... almost end of day for me
- Mark as New
- Bookmark
- Subscribe
- Mute
- Subscribe to RSS Feed
- Permalink
- Report Inappropriate Content
can anyone help with this please?
- Mark as New
- Bookmark
- Subscribe
- Mute
- Subscribe to RSS Feed
- Permalink
- Report Inappropriate Content
Check the attached script
- « Previous Replies
- Next Replies »