Unlock a world of possibilities! Login now and discover the exclusive benefits awaiting you.
- Qlik Community
- :
- All Forums
- :
- QlikView App Dev
- :
- CrossTab Style Chart
- Subscribe to RSS Feed
- Mark Topic as New
- Mark Topic as Read
- Float this Topic for Current User
- Bookmark
- Subscribe
- Mute
- Printer Friendly Page
- Mark as New
- Bookmark
- Subscribe
- Mute
- Subscribe to RSS Feed
- Permalink
- Report Inappropriate Content
CrossTab Style Chart
Hi everyone
Would really appreciate help with this if possible.
Have a QVD file that contains all stock codes, day of week total (every Monday shown), and quantity sold.
The QVD looks something like this:
| StockCode | WeekCreated | Qty Sold |
| Code1 | 18/05/2015 | 1 |
| Code1 | 11/05/2015 | 2 |
| Code1 | 04/05/2015 | 3 |
| Code1 | 27/04/2015 | 4 |
| Code2 | 18/05/2015 | 10 |
| Code2 | 11/05/2015 | 11 |
| Code2 | 04/05/2015 | 12 |
| Code2 | 27/04/2015 | 13 |
| Code3 | 18/05/2015 | 20 |
| Code3 | 11/05/2015 | 21 |
| Code3 | 04/05/2015 | 22 |
| Code3 | 27/04/2015 | 23 |
| Code4 | 18/05/2015 | 30 |
| Code4 | 11/05/2015 | 31 |
| Code4 | 04/05/2015 | 32 |
| Code4 | 27/04/2015 | 33 |
I am trying to turn this into a horizontal straight table, that will look like this.
The stock code (Code1, Code2 etc) will be listed in the first column, the week created will be in the column header, with the QtySold then in the individual cells:
| Qty Sold Chart | ||||
| 18/05/2015 | 11/05/2015 | 04/05/2015 | 27/04/2015 | |
| Code1 | 1 | 10 | 20 | 30 |
| Code2 | 2 | 11 | 21 | 31 |
| Code3 | 3 | 12 | 22 | 32 |
| Code4 | 4 | 13 | 23 | 33 |
Can anyone offer any advise with this? Thanks
- Mark as New
- Bookmark
- Subscribe
- Mute
- Subscribe to RSS Feed
- Permalink
- Report Inappropriate Content
You can use a Pivot table to do what you are trying to do.
- Mark as New
- Bookmark
- Subscribe
- Mute
- Subscribe to RSS Feed
- Permalink
- Report Inappropriate Content
This?
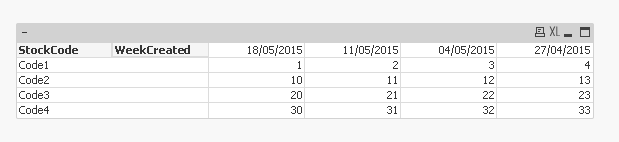
See the attached qvw file for reference.
Best,
Sunny
- Mark as New
- Bookmark
- Subscribe
- Mute
- Subscribe to RSS Feed
- Permalink
- Report Inappropriate Content
Hi Sunny
Absolutely fantastic, works perfectly. Thank you so much 
- Mark as New
- Bookmark
- Subscribe
- Mute
- Subscribe to RSS Feed
- Permalink
- Report Inappropriate Content
No problem Matt
Glad I was able to help.
Best,
Sunny