Unlock a world of possibilities! Login now and discover the exclusive benefits awaiting you.
- Qlik Community
- :
- All Forums
- :
- QlikView App Dev
- :
- Crosstable with multiple Attribute/Data fields
- Subscribe to RSS Feed
- Mark Topic as New
- Mark Topic as Read
- Float this Topic for Current User
- Bookmark
- Subscribe
- Mute
- Printer Friendly Page
- Mark as New
- Bookmark
- Subscribe
- Mute
- Subscribe to RSS Feed
- Permalink
- Report Inappropriate Content
Crosstable with multiple Attribute/Data fields
Is there a way to group attributes and data? If I had a Crosstable like this
| id | revenue Q1 | profit Q1 | revenue Q2 | profit Q2 |
|---|---|---|---|---|
| 1 | 23123 | 213 | 1323 | 213 |
| 2 | 5435 | 3454 | 43534 | 3454 |
And I want to group revenues and profits as separate attributes to display them separately in charts. Now same thing with a lof of different categories, so loading a crosstable for each would be pretty inefficient. Now I guess there might be a way with calculated dimensions or expressions, but I am pretty clueless when it comes to that as I have just started using qlikview, so any help here would be appreciated. Is there anything like regex to match the categories?
Thank you in advance.
-Darren
Accepted Solutions
- Mark as New
- Bookmark
- Subscribe
- Mute
- Subscribe to RSS Feed
- Permalink
- Report Inappropriate Content
You'll have to do it in two steps:
Temp:
CrossTable(Field, Value)
LOAD * FROM ....;
Result:
LOAD
*,
subfield(Field, ' ', 1) as Category,
subfield(Field, ' ', -1) as Quarter
RESIDENT Temp;
DROP TABLE Temp;
talk is cheap, supply exceeds demand
- Mark as New
- Bookmark
- Subscribe
- Mute
- Subscribe to RSS Feed
- Permalink
- Report Inappropriate Content
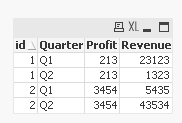
May be this:
Table:
CrossTable(Quarter, Value)
LOAD id,
[revenue Q1]&'|'&[profit Q1],
[revenue Q2]&'|'&[profit Q2]
FROM
[https://community.qlik.com/thread/206120]
(html, codepage is 1252, embedded labels, table is @1);
FinalTable:
LOAD id,
KeepChar(SubField(Quarter, '|', 1), 'Q1234') as Quarter,
SubField(Value, '|', 1) as Revenue,
SubField(Value, '|', 2) as Profit
Resident Table;
DROP Table Table;
- Mark as New
- Bookmark
- Subscribe
- Mute
- Subscribe to RSS Feed
- Permalink
- Report Inappropriate Content
You'll have to do it in two steps:
Temp:
CrossTable(Field, Value)
LOAD * FROM ....;
Result:
LOAD
*,
subfield(Field, ' ', 1) as Category,
subfield(Field, ' ', -1) as Quarter
RESIDENT Temp;
DROP TABLE Temp;
talk is cheap, supply exceeds demand
- Mark as New
- Bookmark
- Subscribe
- Mute
- Subscribe to RSS Feed
- Permalink
- Report Inappropriate Content
Thanks for your answer, it works. One more followup, can you fix a Chart on a category? As in have two charts, one always shows revenue, one always showing profits. Or do I have to do it like the other User suggested and split them into one more column?
- Mark as New
- Bookmark
- Subscribe
- Mute
- Subscribe to RSS Feed
- Permalink
- Report Inappropriate Content
Thanks it works like this, wish I could mark multiple as correct. Is there an alternative to KeepChar here? Cause I have a couple more categories that would contain some of the kept characters.
Thanks again!
- Mark as New
- Bookmark
- Subscribe
- Mute
- Subscribe to RSS Feed
- Permalink
- Report Inappropriate Content
You can try TextBetween() function:
TextBetween(Quarter, ' ', '|')) as Quarter
- Mark as New
- Bookmark
- Subscribe
- Mute
- Subscribe to RSS Feed
- Permalink
- Report Inappropriate Content
You can 'fix' the category in the expression. Change for example sum(Value) to sum({<Category={'Profit'}>}Value)
talk is cheap, supply exceeds demand