Unlock a world of possibilities! Login now and discover the exclusive benefits awaiting you.
- Qlik Community
- :
- All Forums
- :
- QlikView App Dev
- :
- Re: Cumulative stock repeating values on days with...
- Subscribe to RSS Feed
- Mark Topic as New
- Mark Topic as Read
- Float this Topic for Current User
- Bookmark
- Subscribe
- Mute
- Printer Friendly Page
- Mark as New
- Bookmark
- Subscribe
- Mute
- Subscribe to RSS Feed
- Permalink
- Report Inappropriate Content
Cumulative stock repeating values on days with no movement
Hi guys,
I ask for your support to guide me with the following problem:
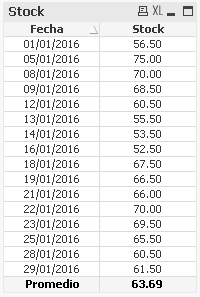
I have a table of materials with their stocks, to calculate them they must be cumulative (and this works correctly), but now the problem occurs when I am asked to keep the stock on the days when there has been no movement. Here is an example:
Current scenario:
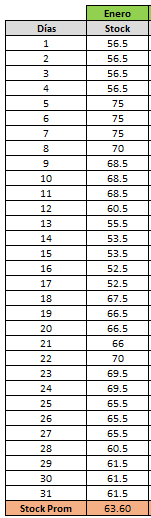
Desired scenario:

As we can see on January 1, 2016 there were movements, and then there was another on January 5, but on days 2, 3 and 4 there were no movements so the stock is what happened on January 1, and So on the days in which there was no movement should be placed the stock of the last day of movement, to thereby be able to perform the average of the day, as shown in the 2nd image.
Thank you in advance for your support.
Greetings.
- Tags:
- cummulative
- Mark as New
- Bookmark
- Subscribe
- Mute
- Subscribe to RSS Feed
- Permalink
- Report Inappropriate Content
It is the average stock of the month.
Regards.
- Mark as New
- Bookmark
- Subscribe
- Mute
- Subscribe to RSS Feed
- Permalink
- Report Inappropriate Content
I think you need a master calendar or something similar to create the missing dates... without that, this probably won't be possible.....
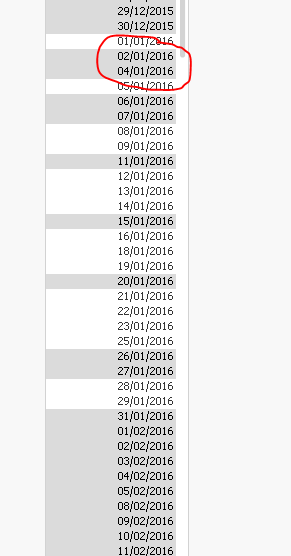
03/01/2016 just doesn't exist.... if it doesn't exist it cannot be averaged into.
- Mark as New
- Bookmark
- Subscribe
- Mute
- Subscribe to RSS Feed
- Permalink
- Report Inappropriate Content
Hi stalwar1,
Yes that's why I just added it but I still do not see how the formula you gave me fit into the chart.
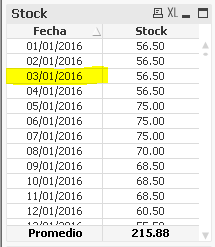
Thank you so much.
Greetings.
- Mark as New
- Bookmark
- Subscribe
- Mute
- Subscribe to RSS Feed
- Permalink
- Report Inappropriate Content
Check attached
Use Year and Month, instead of Ano and Mes for filtering and chart dimensions

- Mark as New
- Bookmark
- Subscribe
- Mute
- Subscribe to RSS Feed
- Permalink
- Report Inappropriate Content
- Mark as New
- Bookmark
- Subscribe
- Mute
- Subscribe to RSS Feed
- Permalink
- Report Inappropriate Content
Hi Sunny Talwar,
With respect to the answer that you indicated to me how I get the average of the last 12 periods?
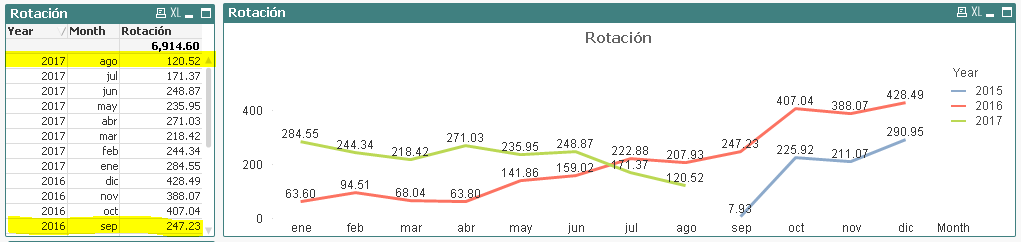
In this case the average would be: 272.1566667.
I would appreciate it if you could give me a suggestion of how it would be, I tried, but I can not find the right result.
Thank you in advance for your support.
Greetings.
- Mark as New
- Bookmark
- Subscribe
- Mute
- Subscribe to RSS Feed
- Permalink
- Report Inappropriate Content
Where exactly do you need this average? In a text box object somewhere?
- Mark as New
- Bookmark
- Subscribe
- Mute
- Subscribe to RSS Feed
- Permalink
- Report Inappropriate Content
Yes.
- Mark as New
- Bookmark
- Subscribe
- Mute
- Subscribe to RSS Feed
- Permalink
- Report Inappropriate Content
Try this
=Sum({<Fe.contabilización = {"$(='>=' & Date(MonthStart(Max(Fe.contabilización), -11), 'DD/MM/YYYY') & '<' & Date(MonthStart(Max(Fe.contabilización), 1), 'DD/MM/YYYY'))"}>}
Aggr(Sum({1<Fe.contabilización = {"$(='>=' & Min(Fe.contabilización))"}>} Aggr(RangeSum(Above(Sum({<Año,Mes, Year, Month>}[Ctd.en UM entrada]) + Avg({1} 0), 0, RowNo())),(Fe.contabilización,(NUMERIC,ASCENDING))))
/ Day(Max({1<Year = p(Year)>}Fe.contabilización)), Year, Month))/12
- Mark as New
- Bookmark
- Subscribe
- Mute
- Subscribe to RSS Feed
- Permalink
- Report Inappropriate Content
And if to the formula I want to add the total exits of the month?

For this case the result is: 0.5125, the same in the text box object (Always the last 12 months).
Thank you in advance for your support.
Greetings.