Unlock a world of possibilities! Login now and discover the exclusive benefits awaiting you.
- Qlik Community
- :
- All Forums
- :
- QlikView App Dev
- :
- Re: Cumulative sum In Pivot Table
- Subscribe to RSS Feed
- Mark Topic as New
- Mark Topic as Read
- Float this Topic for Current User
- Bookmark
- Subscribe
- Mute
- Printer Friendly Page
- Mark as New
- Bookmark
- Subscribe
- Mute
- Subscribe to RSS Feed
- Permalink
- Report Inappropriate Content
Cumulative sum In Pivot Table
Hi,
May I ask for help to show the cumulative sum in a pivot table. I tried the related threads but could not get any answer, so posting a new one.
Problem
I have a table which shows value for some items across the year.
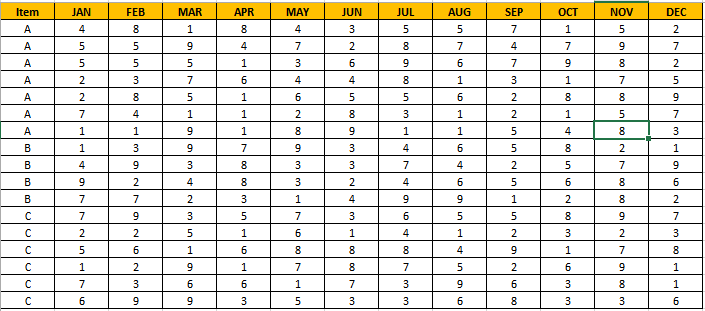
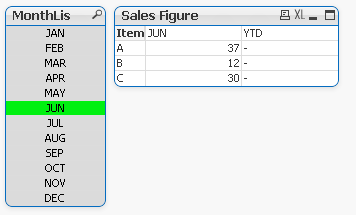
I need to create a pivot table where I need to show 2 columns only
- The sum total for selected month
- The YTD figure till the selected month. (if Jun is selected then sum of JAN+FEB+MAR+.......+JUN) Need HELP HERE
I tried using SumRange for the YTD, but could not crack it. I don't want to show the full table, but to do the calculation in the formula and show the final YTD value.
Like this
Please help.
- Mark as New
- Bookmark
- Subscribe
- Mute
- Subscribe to RSS Feed
- Permalink
- Report Inappropriate Content
Hi,
You can share qvw
- Mark as New
- Bookmark
- Subscribe
- Mute
- Subscribe to RSS Feed
- Permalink
- Report Inappropriate Content
Hi
Can you share mock data, try like below
Expression as YTD Cumulative:
rangesum(above(column(1)),sum(Sales))
or
RangeSum(Above(total sum(Sales), 0, RowNo(TOTAL)))
also check this,
Thanks,Deva
- Mark as New
- Bookmark
- Subscribe
- Mute
- Subscribe to RSS Feed
- Permalink
- Report Inappropriate Content
Hi,
Please find attached the dummy data.
- Mark as New
- Bookmark
- Subscribe
- Mute
- Subscribe to RSS Feed
- Permalink
- Report Inappropriate Content
Thank you Devarasu. Attached is the file.
- Mark as New
- Bookmark
- Subscribe
- Mute
- Subscribe to RSS Feed
- Permalink
- Report Inappropriate Content
Hi,
if it's working fine. can you close this thread by marking correct or helpful. tks
- Mark as New
- Bookmark
- Subscribe
- Mute
- Subscribe to RSS Feed
- Permalink
- Report Inappropriate Content
I suggest using The Crosstable Load to transform your data and then use set analysis here...
- Mark as New
- Bookmark
- Subscribe
- Mute
- Subscribe to RSS Feed
- Permalink
- Report Inappropriate Content
Check the attached
- Mark as New
- Bookmark
- Subscribe
- Mute
- Subscribe to RSS Feed
- Permalink
- Report Inappropriate Content
Try with combination of the RangeSum on pivot table.