Unlock a world of possibilities! Login now and discover the exclusive benefits awaiting you.
- Qlik Community
- :
- All Forums
- :
- QlikView App Dev
- :
- Re: Current Year Problem
- Subscribe to RSS Feed
- Mark Topic as New
- Mark Topic as Read
- Float this Topic for Current User
- Bookmark
- Subscribe
- Mute
- Printer Friendly Page
- Mark as New
- Bookmark
- Subscribe
- Mute
- Subscribe to RSS Feed
- Permalink
- Report Inappropriate Content
Current Year Problem
Hi,
I have data like 2009 - 2012
I want to display only 2012 Data using Set Analysis
For Reference, PFA
- « Previous Replies
-
- 1
- 2
- Next Replies »
- Mark as New
- Bookmark
- Subscribe
- Mute
- Subscribe to RSS Feed
- Permalink
- Report Inappropriate Content
Sunny Got It.
So, PFA of that image.
Here, i want to show the either Ascending / Descending order?
Is there any expression for that from Sorting?
- Anil
- Mark as New
- Bookmark
- Subscribe
- Mute
- Subscribe to RSS Feed
- Permalink
- Report Inappropriate Content
Dimension is not Date here... I think these expression should work with a dimension which is not a date
This Year -> Sum({$<[Year Order Date] = {$(=Max([Year Order Date]))}>} Sales)
Last Year -> Sum({$<[Year Order Date] = {$(=Max([Year Order Date])-1)}>} Sales)
Difference -> (Sum({$<[Year Order Date] = {$(=Max([Year Order Date]))}>} Sales) - Sum({$<[Year Order Date] = {$(=Max([Year Order Date])-1)}>} Sales))
- Mark as New
- Bookmark
- Subscribe
- Mute
- Subscribe to RSS Feed
- Permalink
- Report Inappropriate Content
Sunny,
If i take that expression will coming like below. How to show graphs either Ascending or Descending with Expression from Sorting. For reference, Please find before attachment.
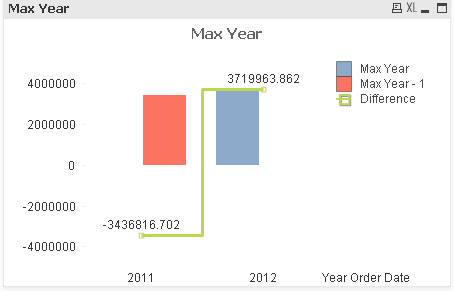
I don't know why -Ve Values came here.
If i take like below. Some kind it is working
(Sum({$<[Year Order Date] = {$(=max([Year Order Date]))}>} Sales)) - (above(Sum({$<[Year Order Date] = {$(=max([Year Order Date])-1)}>} Sales)))
- Mark as New
- Bookmark
- Subscribe
- Mute
- Subscribe to RSS Feed
- Permalink
- Report Inappropriate Content
Sunny,
If you have anything about Set Analysis can you please send me that doc's???
- Anil
- Mark as New
- Bookmark
- Subscribe
- Mute
- Subscribe to RSS Feed
- Permalink
- Report Inappropriate Content
Look at the document attached to this link: Set Analysis: syntaxes, examples. Not a perfect document, but will help you learn a lot about set analysis.
Best,
Sunny
- « Previous Replies
-
- 1
- 2
- Next Replies »