Unlock a world of possibilities! Login now and discover the exclusive benefits awaiting you.
- Qlik Community
- :
- All Forums
- :
- QlikView App Dev
- :
- Custom expression In Bar Chart
- Subscribe to RSS Feed
- Mark Topic as New
- Mark Topic as Read
- Float this Topic for Current User
- Bookmark
- Subscribe
- Mute
- Printer Friendly Page
- Mark as New
- Bookmark
- Subscribe
- Mute
- Subscribe to RSS Feed
- Permalink
- Report Inappropriate Content
Custom expression In Bar Chart
Hello Experts,
I need some help on custom expressions.
As we know we can apply the custom expression to that bar chart.
Here the scenario is suppose i have a bar chart which compares the value( Actual vs Previous).
Bar chart with two bars..I want to have two custom expressions.
When i give the expressions it only considers one custom expression.
What if i want two ?
I have attached a sample test file. Please have a look..
Thanks in advance.
Accepted Solutions
- Mark as New
- Bookmark
- Subscribe
- Mute
- Subscribe to RSS Feed
- Permalink
- Report Inappropriate Content
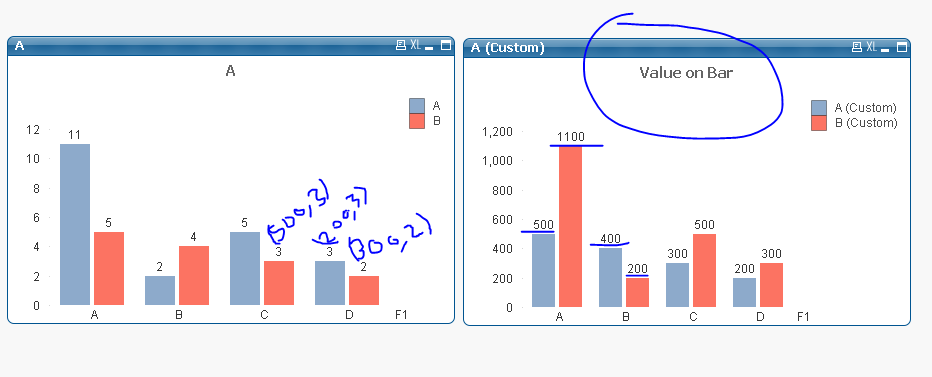
No it doesn't. The bar would always be based on your second argument passed - (Sum(F4) in my sample). You see all bars are showing 555, but the bar lengths are different, isn't it?
- Mark as New
- Bookmark
- Subscribe
- Mute
- Subscribe to RSS Feed
- Permalink
- Report Inappropriate Content
Like this you want ??
- Mark as New
- Bookmark
- Subscribe
- Mute
- Subscribe to RSS Feed
- Permalink
- Report Inappropriate Content

As per my attachment you can see there are only two bars. with some expression.
On the value display i want some other expression(custom) to be displayed.
For example if you are showing the sum of some value. i want to show it percentage with its sum to be displayed.
But the bar expression is calculated on the basis of its sum.
Hope you got my point.
- Mark as New
- Bookmark
- Subscribe
- Mute
- Subscribe to RSS Feed
- Permalink
- Report Inappropriate Content
what's the custom expression your taking about ...I could see your using 2 expression and enable bar for it ...for the other 2 you have not enabled any bar or text pop-up and what your expecting it to show ...I confused
- Mark as New
- Bookmark
- Subscribe
- Mute
- Subscribe to RSS Feed
- Permalink
- Report Inappropriate Content
May be using Dual() like:
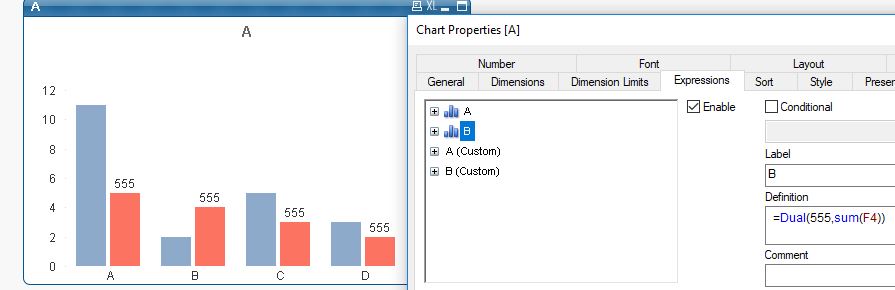
You can replace 555 with your custom expression.
- Mark as New
- Bookmark
- Subscribe
- Mute
- Subscribe to RSS Feed
- Permalink
- Report Inappropriate Content
But if i use dual. according the value the bar also changes.
I want to show my bar with sum(Value). And value on popup(In place of 555 i want to show sum and its percentage).
- Mark as New
- Bookmark
- Subscribe
- Mute
- Subscribe to RSS Feed
- Permalink
- Report Inappropriate Content
No it doesn't. The bar would always be based on your second argument passed - (Sum(F4) in my sample). You see all bars are showing 555, but the bar lengths are different, isn't it?
- Mark as New
- Bookmark
- Subscribe
- Mute
- Subscribe to RSS Feed
- Permalink
- Report Inappropriate Content
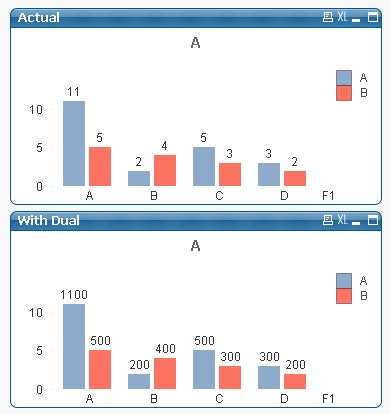
To Be more clear . See the screenshot below.
There is one bar chart with some data . The second chart expression is different (%).
I want to display them on the 1st chart.
- Mark as New
- Bookmark
- Subscribe
- Mute
- Subscribe to RSS Feed
- Permalink
- Report Inappropriate Content
Not sure if understood right. This?
- Mark as New
- Bookmark
- Subscribe
- Mute
- Subscribe to RSS Feed
- Permalink
- Report Inappropriate Content
Yes. This Works. Thanks for the Time:)