Unlock a world of possibilities! Login now and discover the exclusive benefits awaiting you.
- Qlik Community
- :
- All Forums
- :
- QlikView App Dev
- :
- Re: Customized Total Expression
- Subscribe to RSS Feed
- Mark Topic as New
- Mark Topic as Read
- Float this Topic for Current User
- Bookmark
- Subscribe
- Mute
- Printer Friendly Page
- Mark as New
- Bookmark
- Subscribe
- Mute
- Subscribe to RSS Feed
- Permalink
- Report Inappropriate Content
Customized Total Expression
Hello,
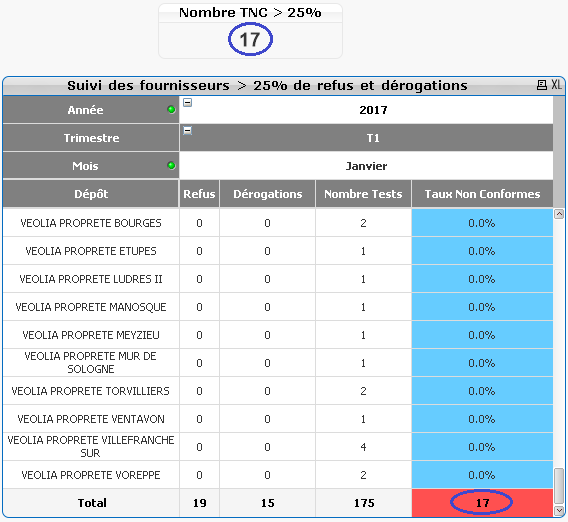
I would like to customize the total expression in a multi dimensional table in order to obtain something like the picture below.
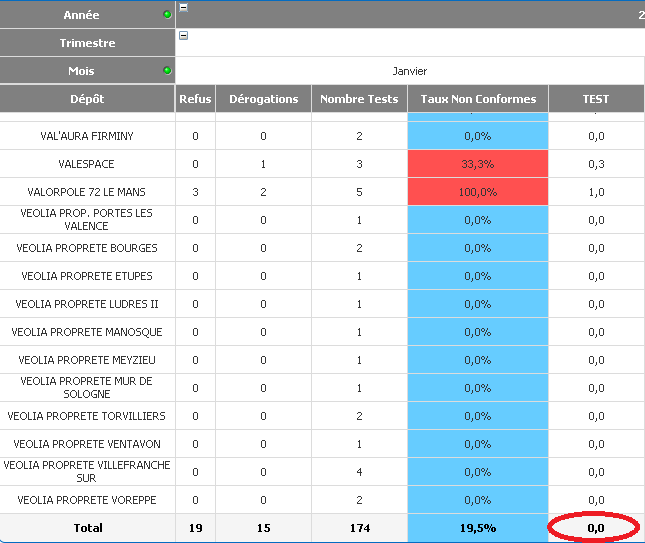
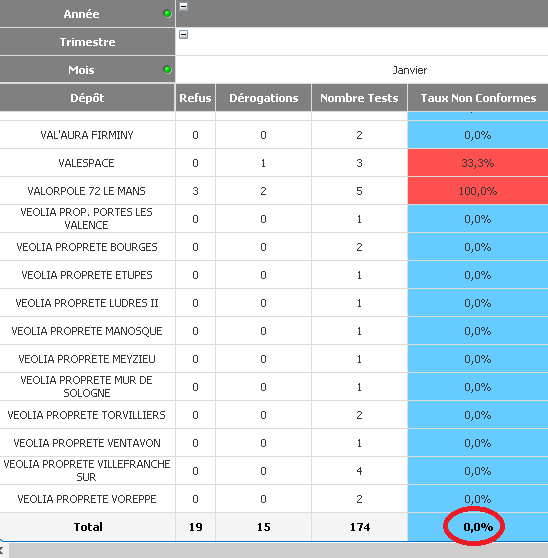
Let's focus now on my real table below :

I have worked on the code below for the column TEST :
if( Dimensionality()=0
, count(
aggr(
if([Taux Non Conformes] >= 0.25, 1)
, depot, Année, TrimDate, Mois_Ecrit_En_Entier
)
)
, [Taux Non Conformes]
)
So, I want to get the number of lines that are >= 25% but the total always show 0.0.
Any idea ?
- Mark as New
- Bookmark
- Subscribe
- Mute
- Subscribe to RSS Feed
- Permalink
- Report Inappropriate Content
Is [Taux Non Conformes] a field name or is this column label in the chart? If this is a column label, then it won't work within the Aggr() function... in order to use this within the Aggr() function, you will have to use the actual variable behind [Taux Non Conformes]
- Mark as New
- Bookmark
- Subscribe
- Mute
- Subscribe to RSS Feed
- Permalink
- Report Inappropriate Content
Replace [Taux Non Conformes] with the actual expression.....
if( Dimensionality()=0
, count(
aggr(
if([Taux Non Conformes] >= 0.25, 1)
, depot, Année, TrimDate, Mois_Ecrit_En_Entier
)
)
, [Taux Non Conformes]
)
- Mark as New
- Bookmark
- Subscribe
- Mute
- Subscribe to RSS Feed
- Permalink
- Report Inappropriate Content
Ok, I changed the expression for [Taux Non Conformes].
if( Dimensionality()=0
, count(
aggr(
if(((count(if(Dérogation = 'Avec Dérogation', 1)) + count(if(Statut = 'Refusé', 1))) / count(N°Echantillonage)) >= 0.25, 1)
, depot, Année, TrimDate, Mois_Ecrit_En_Entier
)
)
, (count(if(Dérogation = 'Avec Dérogation', 1)) + count(if(Statut = 'Refusé', 1))) / count(N°Echantillonage)
)
I am supposed to obtain the total number of lines >= 0.25 but the total is still showing 0,0.

- Mark as New
- Bookmark
- Subscribe
- Mute
- Subscribe to RSS Feed
- Permalink
- Report Inappropriate Content
How about if you do this?
If(Dimensionality()=0
, count(TOTAL
aggr(
if(((count(if(Dérogation = 'Avec Dérogation', 1)) + count(if(Statut = 'Refusé', 1))) / count(N°Echantillonage)) >= 0.25, 1)
, depot, Année, TrimDate, Mois_Ecrit_En_Entier
)
)
, (count(if(Dérogation = 'Avec Dérogation', 1)) + count(if(Statut = 'Refusé', 1))) / count(N°Echantillonage)
)
- Mark as New
- Bookmark
- Subscribe
- Mute
- Subscribe to RSS Feed
- Permalink
- Report Inappropriate Content
It doesn't work. Still 0,0 displayed.
- Mark as New
- Bookmark
- Subscribe
- Mute
- Subscribe to RSS Feed
- Permalink
- Report Inappropriate Content
Would you be able to share a sample to check this out?
- Mark as New
- Bookmark
- Subscribe
- Mute
- Subscribe to RSS Feed
- Permalink
- Report Inappropriate Content
Hi,
Here is the solution to my problem :
=if( Dimensionality()=0
, num(count(distinct {< Depot={"=((count(if(Dérogation = 'Avec Dérogation', 1)) + count(if(Statut = 'Refusé', 1))) / count(N°Echantillonage))>0.25"} >} Depot),'0')
, num((count(if(Dérogation = 'Avec Dérogation', 1)) + count(if(Statut = 'Refusé', 1))) / count(N°Echantillonage),'0.0%')
)
Table properties => numbers => expression "Taux Non Conformes" => default format
Expression "Taux Non Conformes" :
- use num() to display data as % and total as integer.
- use a set analysis on the function count(distinct Depot) to count only depots with taux > 25%.
NOTA :
This set analysis syntax is quite tricky compared to the classic one because you loose the syntaxic analyser.
Another example to illustrate the problem :
We want to count the number of clients having a CA > 1 million.
We use Count(Distinct ClientId).
We put a set analysis on the function to calculate the CA > 1 million :
Count(distinct {< ClientId = {‘’ =sum(CA)>1000000 ’’} >} ClientId)
=> Yata !
