Unlock a world of possibilities! Login now and discover the exclusive benefits awaiting you.
- Qlik Community
- :
- All Forums
- :
- QlikView App Dev
- :
- Dashboard framework creation
- Subscribe to RSS Feed
- Mark Topic as New
- Mark Topic as Read
- Float this Topic for Current User
- Bookmark
- Subscribe
- Mute
- Printer Friendly Page
- Mark as New
- Bookmark
- Subscribe
- Mute
- Subscribe to RSS Feed
- Permalink
- Report Inappropriate Content
Dashboard framework creation
Not sure if this forum is the best place for this discussion so please let me know if this should be moved.
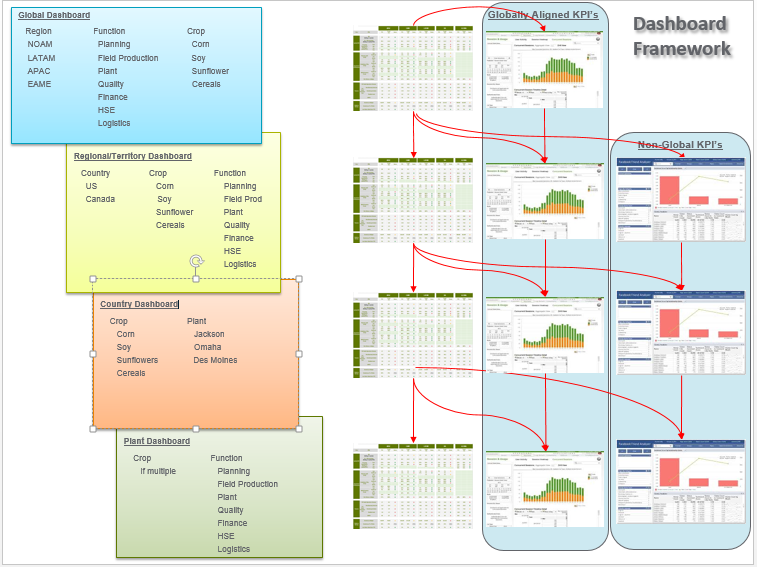
I'm not a QV developer but I've been working with a group of developers over the last 1 1/2 years to model and visualize data from different sources (primary SAP but there will be many others). We are working on integrating relevant data within a data ecosystem upon which data consumption tools such QV will reside. The data is modeled at a granular level, allowing us to aggregate data from a Plant, Country, Region, to Global quite easily. I would like to create a KPI dashboard at each possible level (Global, Region, Country, Plant) which would provide an overview of the current state (Actual, Target, Traffic light - Green, Yellow, Red). Each KPI within each dashboard would then be linked to a specific visualization that would allow the user more granular data at the level selected by the user. My intention is to create a spreadsheet which would allow us to manage the conditions required for each visualization and automate the building of dashboards. QV would monitor this spreadsheet and update conditions within all dashboards/visualizations as changes are made.
For instance, if a user navigates from Global to North America to United States to Plant#1 and selects KPI #1 from the Plant dashboard the user would be taken to the visualization which is described by the conditions selected (North Am., US, Plant#1) along with any conditions previously identified (not by the user) for the visualization. The user and visualization (not by user) conditions would then provide the definition required to visualize KPI #1 for the user at the intended level.
This framework is intended to be a standardized, aligned and scaleable model to enable automated dashboard creation over time. Since we may have 300+ dashboards (if we go down to the plant level) I felt that automating the dashboard building was the best approach, so each group would only need to manage their conditions and not mess with building.
The attachment shows a cascading dashboard which allows us to align KPI's within the dashboard/visualization at any level.
Has anyone done something like this before? Any tips would be helpful? Are there any QV extensions that are built to handle or help with something like this?
Thanks,
Jon