Unlock a world of possibilities! Login now and discover the exclusive benefits awaiting you.
- Qlik Community
- :
- All Forums
- :
- QlikView App Dev
- :
- Data Comparison
- Subscribe to RSS Feed
- Mark Topic as New
- Mark Topic as Read
- Float this Topic for Current User
- Bookmark
- Subscribe
- Mute
- Printer Friendly Page
- Mark as New
- Bookmark
- Subscribe
- Mute
- Subscribe to RSS Feed
- Permalink
- Report Inappropriate Content
Data Comparison
Hi Guys,
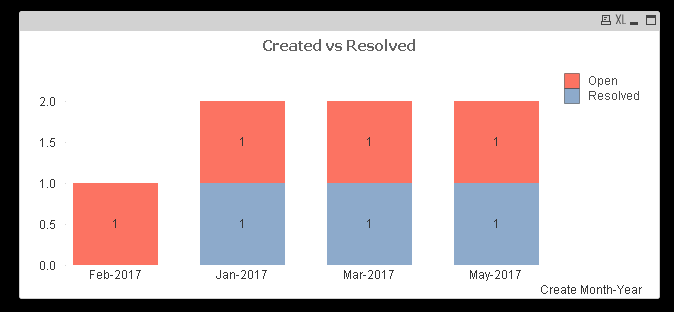
I am new to qlikview and looking to create a grouped bar chart to show resolved records vs created in a given month for 2017. My date is as follows -
Record,Create Month-Year,Resolved Month-Year,Status
Record1,Jan-2017,Jun-2017,Resolved
Record2,Feb-2017,<Blank>,Open
Record3,Mar-2017,May-2017,Resolved
Record4,May-2017,May-2017,Resolved
...etc.
Any help you guys can provide would be very helpful.
Thanks.
- Mark as New
- Bookmark
- Subscribe
- Mute
- Subscribe to RSS Feed
- Permalink
- Report Inappropriate Content
How you want to show? Would you help us the expected result
- Mark as New
- Bookmark
- Subscribe
- Mute
- Subscribe to RSS Feed
- Permalink
- Report Inappropriate Content
Hi,
May be like at attached file?
Regards,
Andrey
- Mark as New
- Bookmark
- Subscribe
- Mute
- Subscribe to RSS Feed
- Permalink
- Report Inappropriate Content
you can show this way.
Pls refer the attached QV document. You can definitely modify it the way you want.
- Mark as New
- Bookmark
- Subscribe
- Mute
- Subscribe to RSS Feed
- Permalink
- Report Inappropriate Content
Thanks Guys. Either a grouped bar chart or stacked would be fine. Can you copy/paste the script as I have the personal edition of QV.
- Mark as New
- Bookmark
- Subscribe
- Mute
- Subscribe to RSS Feed
- Permalink
- Report Inappropriate Content
This will work. Can you provide the script below as I can't open the attachment. Thanks.