Unlock a world of possibilities! Login now and discover the exclusive benefits awaiting you.
- Qlik Community
- :
- All Forums
- :
- QlikView App Dev
- :
- Re: Re: Re: Data Linking
- Subscribe to RSS Feed
- Mark Topic as New
- Mark Topic as Read
- Float this Topic for Current User
- Bookmark
- Subscribe
- Mute
- Printer Friendly Page
- Mark as New
- Bookmark
- Subscribe
- Mute
- Subscribe to RSS Feed
- Permalink
- Report Inappropriate Content
Data Linking
Hi All,
I have 2 data files Actual, Given.
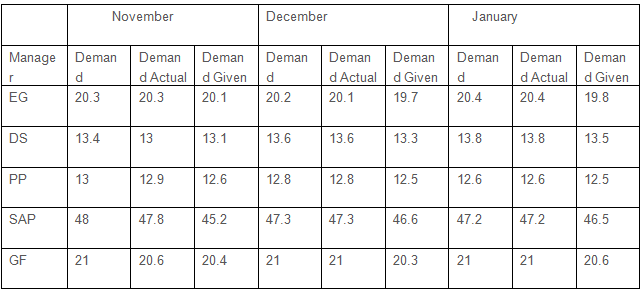
Actual data file contains Project Num, PName, Pool,Manager, November, December, January fields. Here November, december, january fields contains month wise Demand data
Given Data file contains Project Num, PName, Pool, Manager, Month, Demand Actual, Demand Given. Here Month contains November, December, January as field values.
I want to show by default the data for November, December and January should be as follows
I want to create one List box which contains Months November, December and January. If i click on January then only january should be shown, If i click on November then only November data should be shown.
This is an urgent requirement, Please Anybody take a look and give me solution.
I'm attaching sample data files also, Please provide me solution
- Tags:
- new_to_qlikview
Accepted Solutions
- Mark as New
- Bookmark
- Subscribe
- Mute
- Subscribe to RSS Feed
- Permalink
- Report Inappropriate Content
You can use the crosstable function to transform the Actual data. See attached qvw
talk is cheap, supply exceeds demand
- Mark as New
- Bookmark
- Subscribe
- Mute
- Subscribe to RSS Feed
- Permalink
- Report Inappropriate Content
hi have a look at the attach file
all that was needed is to cross table to actual data in the load script
- Mark as New
- Bookmark
- Subscribe
- Mute
- Subscribe to RSS Feed
- Permalink
- Report Inappropriate Content
You can use the crosstable function to transform the Actual data. See attached qvw
talk is cheap, supply exceeds demand
- Mark as New
- Bookmark
- Subscribe
- Mute
- Subscribe to RSS Feed
- Permalink
- Report Inappropriate Content
Hi Bra'am,
Thanks for reply, i met my req with your suggestion.
Thanks,
M V
- Mark as New
- Bookmark
- Subscribe
- Mute
- Subscribe to RSS Feed
- Permalink
- Report Inappropriate Content
Hi Wassenaar,
Sorry for troubling you, One more req is added here
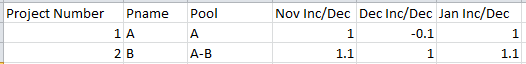
I have another file Inc Data which contains Project Number, PName, Pool, Nov Inc/Dec, Dec Inc/Dec, Jan Inc/Dec fields. Based on the Pool and project number i have to add the values of Nov Inc/Dec, Dec Inc/Dec, Jan Inc/Dec to Demand data
For ex:
In demand data file data is like as follows

in Inc Data file the data is like as follows
It should add to Demand of Demand data file, Then the output will be like as follows
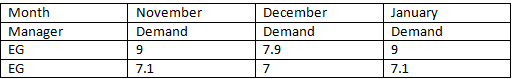
If the value is negative the it should subtract, if value is Possitive then it should add to Demand data and it should reflect on Demand and total (in exapmle 9, 7.1) should show in the table.
Please help me on this
i'm attaching Inc Data file also here.
Thanks,
M V
- Mark as New
- Bookmark
- Subscribe
- Mute
- Subscribe to RSS Feed
- Permalink
- Report Inappropriate Content
Maybe like attached qvw.
talk is cheap, supply exceeds demand