Unlock a world of possibilities! Login now and discover the exclusive benefits awaiting you.
- Qlik Community
- :
- All Forums
- :
- QlikView App Dev
- :
- Date as dimension but showing only month in chart
- Subscribe to RSS Feed
- Mark Topic as New
- Mark Topic as Read
- Float this Topic for Current User
- Bookmark
- Subscribe
- Mute
- Printer Friendly Page
- Mark as New
- Bookmark
- Subscribe
- Mute
- Subscribe to RSS Feed
- Permalink
- Report Inappropriate Content
Date as dimension but showing only month in chart
Is it possible to have a linechart with date as a hidden dimension but displaying month as kind of a reference to what dates are displayed?
I'll try to visualize what I'm trying to accomplish
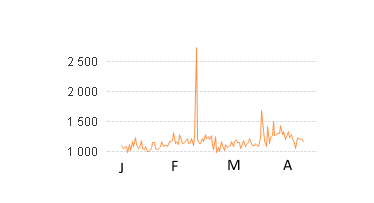
In this example I have selected Jan, Feb, Mar and Apr. The reference can be either on the first or 15 doesn't really matter.
Any help is appreciated
Thank you
- Mark as New
- Bookmark
- Subscribe
- Mute
- Subscribe to RSS Feed
- Permalink
- Report Inappropriate Content
HI,
if you use a master calendar add an additional field (e.g. dspMonth)
Cal:
LOAD
     Date,
     Dual(If(Day(Date) = 1, MonthName(Date), ''), Date) as dspMonth // Reference on 1st day
...
and use dspMonth as Dimension.
If you need the reference on the 15th day use
If(Day(Date) = 15, ...
or
If(Day(Date) = 1 or Day(Date) = 15, ...
if you want two references.
Regards
Sebastian Lettner
- Mark as New
- Bookmark
- Subscribe
- Mute
- Subscribe to RSS Feed
- Permalink
- Report Inappropriate Content
Interesting approach. I will try it.
I tried adding an extra expression with "text on axis"
if(right(%Date,2)=15,MonthShort,null())
This works just as I want it but the text is Strike through and I can't manage to remove it?
I'll give your example a try.
- Mark as New
- Bookmark
- Subscribe
- Mute
- Subscribe to RSS Feed
- Permalink
- Report Inappropriate Content
Sebastian,
That is nice. I have done similar before in the front end, but your way in the load script is much easier.