Unlock a world of possibilities! Login now and discover the exclusive benefits awaiting you.
- Qlik Community
- :
- All Forums
- :
- QlikView App Dev
- :
- Date range in Set Analysis
- Subscribe to RSS Feed
- Mark Topic as New
- Mark Topic as Read
- Float this Topic for Current User
- Bookmark
- Subscribe
- Mute
- Printer Friendly Page
- Mark as New
- Bookmark
- Subscribe
- Mute
- Subscribe to RSS Feed
- Permalink
- Report Inappropriate Content
Date range in Set Analysis
Hi All,
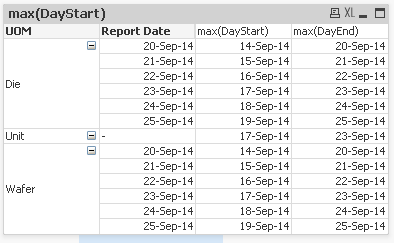
I have here a table:

I need to create an analysis, what is the total Qty of the Report Date with the specific date range.
ex: For Report date 20-Sep-14, the range is >=14-SEp-14<=20-Sep-14
How can I include this in my set analysis?
Thanks!
- « Previous Replies
-
- 1
- 2
- Next Replies »
- Mark as New
- Bookmark
- Subscribe
- Mute
- Subscribe to RSS Feed
- Permalink
- Report Inappropriate Content
=Sum({<Report_Date={'>=$(=Max(DayStart)<=$(=Max(DayEnd)'}>}Qty)
Make sure Report_Date and Max(DayStart) are in same format
- Mark as New
- Bookmark
- Subscribe
- Mute
- Subscribe to RSS Feed
- Permalink
- Report Inappropriate Content
yes, but that will only get the maximum dayend and daystart. i need to get per row
- Mark as New
- Bookmark
- Subscribe
- Mute
- Subscribe to RSS Feed
- Permalink
- Report Inappropriate Content
Do you have that range in a variable or you calculate it?
- Mark as New
- Bookmark
- Subscribe
- Mute
- Subscribe to RSS Feed
- Permalink
- Report Inappropriate Content
It is calculated. Report Date - 6 days
- Mark as New
- Bookmark
- Subscribe
- Mute
- Subscribe to RSS Feed
- Permalink
- Report Inappropriate Content
Hi Lyn,
Do have a field which have Dtae=14 Sep 2014 and a Quentity associated with it?
Over gere i guess max(start date) is a calculated field.
Regards
KC
KC
- Mark as New
- Bookmark
- Subscribe
- Mute
- Subscribe to RSS Feed
- Permalink
- Report Inappropriate Content
Then try like this
=Sum({<Report_Date={'>=$(=date(Max(DayStart)-6))<=$(=Max(DayEnd))'}>}Qty)
Regards
ASHFAQ
- Mark as New
- Bookmark
- Subscribe
- Mute
- Subscribe to RSS Feed
- Permalink
- Report Inappropriate Content
Hi, Report date is associated with the Qty. Yes, for example I have to find the quantity between the dates given above.
If report date is 20-Sep-14 then the date range should be from what is above.
- Mark as New
- Bookmark
- Subscribe
- Mute
- Subscribe to RSS Feed
- Permalink
- Report Inappropriate Content
Hi doing this will only take the maximum of all..
so max(daystart) will not compute per row but will compute the total.. so max(daystart) in that set analysis will output = 19-sep-14
- Mark as New
- Bookmark
- Subscribe
- Mute
- Subscribe to RSS Feed
- Permalink
- Report Inappropriate Content
Hi,
then try your expression with if clause
Regards
Please appreciate our Qlik community members by giving Kudos for sharing their time for your query. If your query is answered, please mark the topic as resolved 🙂
- « Previous Replies
-
- 1
- 2
- Next Replies »