Unlock a world of possibilities! Login now and discover the exclusive benefits awaiting you.
- Qlik Community
- :
- All Forums
- :
- QlikView App Dev
- :
- Re: Date sorting in previous year comparison bar c...
- Subscribe to RSS Feed
- Mark Topic as New
- Mark Topic as Read
- Float this Topic for Current User
- Bookmark
- Subscribe
- Mute
- Printer Friendly Page
- Mark as New
- Bookmark
- Subscribe
- Mute
- Subscribe to RSS Feed
- Permalink
- Report Inappropriate Content
Date sorting in previous year comparison bar chart.
I have a chart that compares a 30 day range to the same 30 day range from the previous year. Currently the chart looks like this:
Green = 2015
Beige = 2016
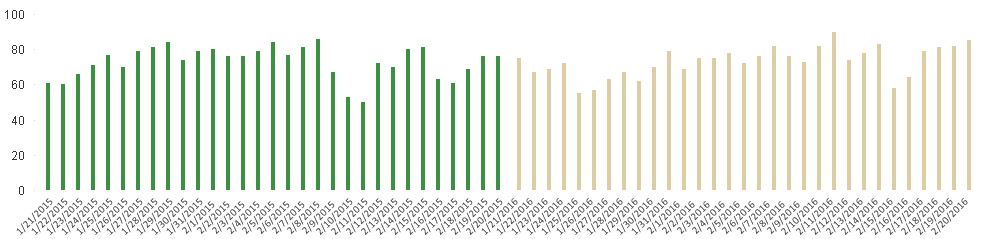
I really want the bars for the same month and day placed next to each other, instead of the the group of dates showing for one year and than the other. My dimension is simply a date. Is there an expression that I can sort on to achieve what I want, or is there another approach all together?
- Mark as New
- Bookmark
- Subscribe
- Mute
- Subscribe to RSS Feed
- Permalink
- Report Inappropriate Content
Change your dimension from date to a calculated one -> Date(Date#(SubField(DateField, '/', 1) & '/' & SubField(DateField, '/', 2), 'M/D'), 'M/D')
- Mark as New
- Bookmark
- Subscribe
- Mute
- Subscribe to RSS Feed
- Permalink
- Report Inappropriate Content
I ended up using a similar concept without forcing it as a date, as this seems to break my set analysis. I used Num(Month(DateField),'00')&Num(Day(DateField),'00').
- Mark as New
- Bookmark
- Subscribe
- Mute
- Subscribe to RSS Feed
- Permalink
- Report Inappropriate Content
Use Day(YourDateField) as your dimension instead of YourDateField.
Day gives the day of the Month (1-31)