Unlock a world of possibilities! Login now and discover the exclusive benefits awaiting you.
- Qlik Community
- :
- All Forums
- :
- QlikView App Dev
- :
- Re: Dates and Stacked Bar Chart
- Subscribe to RSS Feed
- Mark Topic as New
- Mark Topic as Read
- Float this Topic for Current User
- Bookmark
- Subscribe
- Mute
- Printer Friendly Page
- Mark as New
- Bookmark
- Subscribe
- Mute
- Subscribe to RSS Feed
- Permalink
- Report Inappropriate Content
Dates and Stacked Bar Chart
Team,
I have a time stamp that I am pulling for a Remedy system. I'm adjusting it because the date is stored as seconds since 1970 (I think)
Date((ARRIVAL_TIME/ 86400 + 25569),'DD-MM-YYYY hh') as [IM Arrival Date Hour],
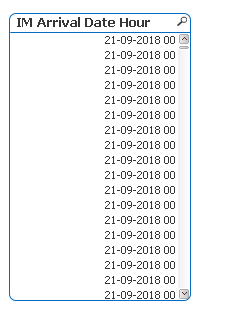
I end up with a value that looks like the list box below which looks like what I'm after.

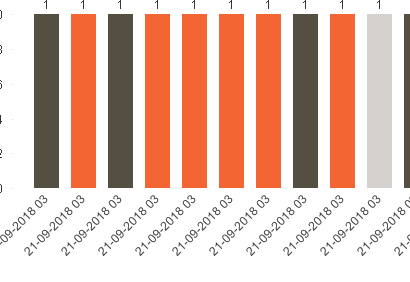
Now, I'm trying to chart this data along with "Category" data in a stacked bar chart. The problem that I am having is that even though I'm selecting a stacked in the style tab, they are not being stacked. I am trying to get the different categories stack by date hour into a single bar. but I get individual bars.. See below.

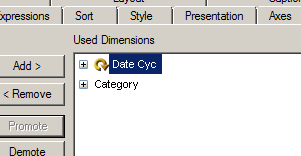
Here is my demission. The cyclic toggles between the date and the date hour timestamp

Any ideas?
Accepted Solutions
- Mark as New
- Bookmark
- Subscribe
- Mute
- Subscribe to RSS Feed
- Permalink
- Report Inappropriate Content
Try this
Date(Floor((ARRIVAL_TIME/ 86400 + 25569), 1/24),'DD-MM-YYYY hh') as [IM Arrival Date Hour],
- Mark as New
- Bookmark
- Subscribe
- Mute
- Subscribe to RSS Feed
- Permalink
- Report Inappropriate Content
Try this
Date(Floor((ARRIVAL_TIME/ 86400 + 25569), 1/24),'DD-MM-YYYY hh') as [IM Arrival Date Hour],
- Mark as New
- Bookmark
- Subscribe
- Mute
- Subscribe to RSS Feed
- Permalink
- Report Inappropriate Content
Thanks Sunny! I don't understand why, but works perfectly!
- Mark as New
- Bookmark
- Subscribe
- Mute
- Subscribe to RSS Feed
- Permalink
- Report Inappropriate Content
Although, you were seeing only up until hours because of your formatting, the underlying value still included minutes and seconds information. By using Floor, we removed the minutes and seconds which made stacking possible.
- Mark as New
- Bookmark
- Subscribe
- Mute
- Subscribe to RSS Feed
- Permalink
- Report Inappropriate Content
Thanks Sunny. That makes sense now that you have explained it.
Thanks again!