Unlock a world of possibilities! Login now and discover the exclusive benefits awaiting you.
Announcements
Qlik Open Lakehouse is Now Generally Available! Discover the key highlights and partner resources here.
- Qlik Community
- :
- All Forums
- :
- QlikView App Dev
- :
- Re: Day and Month on x axis in graph
Options
- Subscribe to RSS Feed
- Mark Topic as New
- Mark Topic as Read
- Float this Topic for Current User
- Bookmark
- Subscribe
- Mute
- Printer Friendly Page
Turn on suggestions
Auto-suggest helps you quickly narrow down your search results by suggesting possible matches as you type.
Showing results for
Creator
2016-05-20
07:04 AM
- Mark as New
- Bookmark
- Subscribe
- Mute
- Subscribe to RSS Feed
- Permalink
- Report Inappropriate Content
Day and Month on x axis in graph
Hi!
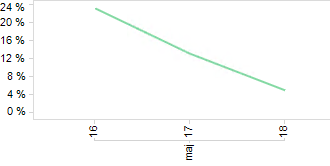
Is it possible to have two dimentions on the x-axis in a graph?.
As in example below, Day and Month
See my data in the enclose qvw
/Stefan
488 Views
1 Reply
Partner - Creator II
2016-05-20
10:09 AM
- Mark as New
- Bookmark
- Subscribe
- Mute
- Subscribe to RSS Feed
- Permalink
- Report Inappropriate Content
Hi Stefan,
Unfortunately it's not possible in QlikView to have two dimension in a line chart to create a graph as you showed. By creating a field consisting out of month and the day number or by using a drill dimensions (drilling down from month to day) you almost meet the requirement. Check the attached app.
Cheers,
Michiel
388 Views