Unlock a world of possibilities! Login now and discover the exclusive benefits awaiting you.
- Qlik Community
- :
- All Forums
- :
- QlikView App Dev
- :
- Diagram / chart doesn't show all values
- Subscribe to RSS Feed
- Mark Topic as New
- Mark Topic as Read
- Float this Topic for Current User
- Bookmark
- Subscribe
- Mute
- Printer Friendly Page
- Mark as New
- Bookmark
- Subscribe
- Mute
- Subscribe to RSS Feed
- Permalink
- Report Inappropriate Content
Diagram / chart doesn't show all values
Hello dear community
I have the following problem:
I want to show all avail. data in a diagram !without! using the continuous funktion or scrolling of the x-axis.
see also:
http://community.qlik.com/message/46518#46518
as you see, my data is not continuous and I do not want to see these breaks:

when not using continuous and xaxis scrolling , only the first 2 hrs are shown (complete data of selection = 2 days(1900 rows)):

Thx in advance
cheers chesterluck
- « Previous Replies
-
- 1
- 2
- Next Replies »
- Mark as New
- Bookmark
- Subscribe
- Mute
- Subscribe to RSS Feed
- Permalink
- Report Inappropriate Content
Thanks; I’m not sure how you upload files to the Community, but I’m giving it a try.
- Mark as New
- Bookmark
- Subscribe
- Mute
- Subscribe to RSS Feed
- Permalink
- Report Inappropriate Content
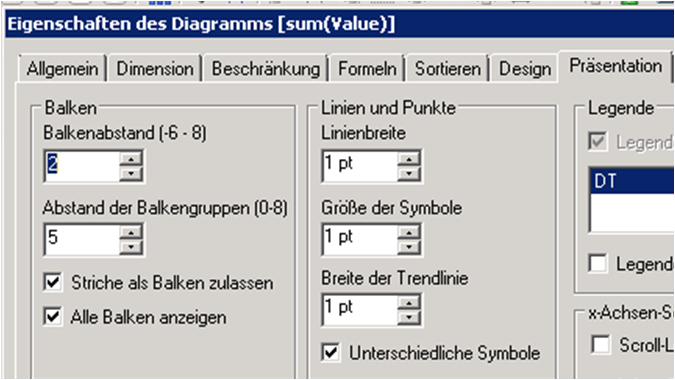
I dont really get the problem. In the file everything is shown already. The first diagramm is correct. the second not.
the difference are the following properties in the presentation part: Check the 2 checkboxes on the left :
Striche als Balken zulassen and Alle Balken anzeigen.
So in english sth like allow lines as bars and show all bars. Dont forget to use the Combidiagramm on first prop tab. cheers chesterlcuk
- Mark as New
- Bookmark
- Subscribe
- Mute
- Subscribe to RSS Feed
- Permalink
- Report Inappropriate Content
That is absolutely fantastic! I’m not sure how I missed that... Made my day!
- Mark as New
- Bookmark
- Subscribe
- Mute
- Subscribe to RSS Feed
- Permalink
- Report Inappropriate Content
Your welcome 
- « Previous Replies
-
- 1
- 2
- Next Replies »