Unlock a world of possibilities! Login now and discover the exclusive benefits awaiting you.
- Qlik Community
- :
- All Forums
- :
- QlikView App Dev
- :
- Re: Dialog different from table
- Subscribe to RSS Feed
- Mark Topic as New
- Mark Topic as Read
- Float this Topic for Current User
- Bookmark
- Subscribe
- Mute
- Printer Friendly Page
- Mark as New
- Bookmark
- Subscribe
- Mute
- Subscribe to RSS Feed
- Permalink
- Report Inappropriate Content
Dialog different from table
Hi,
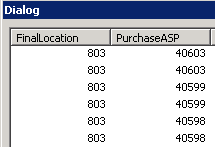
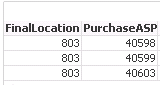
When I go to "Table Viewer" right click to preview the "Dialog" it shows my information but when I create a new "Chart" or "Table box" it shows me less information. the "Dialog" previewer shows me 4 records but the "Chart" or "Table box" shows only 2 records.
What would cause the Dialog box be different from a table or chart?
thank you in advance!
- « Previous Replies
-
- 1
- 2
- Next Replies »
Accepted Solutions
- Mark as New
- Bookmark
- Subscribe
- Mute
- Subscribe to RSS Feed
- Permalink
- Report Inappropriate Content
Hope the Attached file will solve your issue. I have added RowNo to the records and hided the column
- Mark as New
- Bookmark
- Subscribe
- Mute
- Subscribe to RSS Feed
- Permalink
- Report Inappropriate Content
Share the image or application to check the issue
- Mark as New
- Bookmark
- Subscribe
- Mute
- Subscribe to RSS Feed
- Permalink
- Report Inappropriate Content
- Mark as New
- Bookmark
- Subscribe
- Mute
- Subscribe to RSS Feed
- Permalink
- Report Inappropriate Content
It is showing the Distinct values.
what I the expression you have used in the chart?
- Mark as New
- Bookmark
- Subscribe
- Mute
- Subscribe to RSS Feed
- Permalink
- Report Inappropriate Content
no expression. even if i create a table box or a list box it only shows 3 records instead of the 6.
- Mark as New
- Bookmark
- Subscribe
- Mute
- Subscribe to RSS Feed
- Permalink
- Report Inappropriate Content
In List box or Table box, by default it will show only distinct Values. You should add the other columns which has values that are not distinct.
- Mark as New
- Bookmark
- Subscribe
- Mute
- Subscribe to RSS Feed
- Permalink
- Report Inappropriate Content
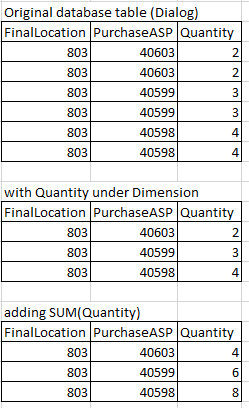
that's correct I was just trying to give you more samples on were the records are not displaying properly. it seems to only work when I create a basic Chart using SUM(Quantity) and not just Quantity. I shouldn't have to do this it should just display the same as the Database (Dialog box).
- Mark as New
- Bookmark
- Subscribe
- Mute
- Subscribe to RSS Feed
- Permalink
- Report Inappropriate Content
So the Column which has unique values are Quantity.
If you add Quantity as your Dimension the issue will be solved I Hope. for expression just add 1 and hide that column in Presentation tab.
- Mark as New
- Bookmark
- Subscribe
- Mute
- Subscribe to RSS Feed
- Permalink
- Report Inappropriate Content
here's what the report displays. I need the chart to look like the original.
thanks for your help so far!!!
- Mark as New
- Bookmark
- Subscribe
- Mute
- Subscribe to RSS Feed
- Permalink
- Report Inappropriate Content
Hope the Attached file will solve your issue. I have added RowNo to the records and hided the column
- « Previous Replies
-
- 1
- 2
- Next Replies »