Unlock a world of possibilities! Login now and discover the exclusive benefits awaiting you.
- Qlik Community
- :
- All Forums
- :
- QlikView App Dev
- :
- Difference between Chart in Design and Web (Plugin...
- Subscribe to RSS Feed
- Mark Topic as New
- Mark Topic as Read
- Float this Topic for Current User
- Bookmark
- Subscribe
- Mute
- Printer Friendly Page
- Mark as New
- Bookmark
- Subscribe
- Mute
- Subscribe to RSS Feed
- Permalink
- Report Inappropriate Content
Difference between Chart in Design and Web (Plugin)
Hi
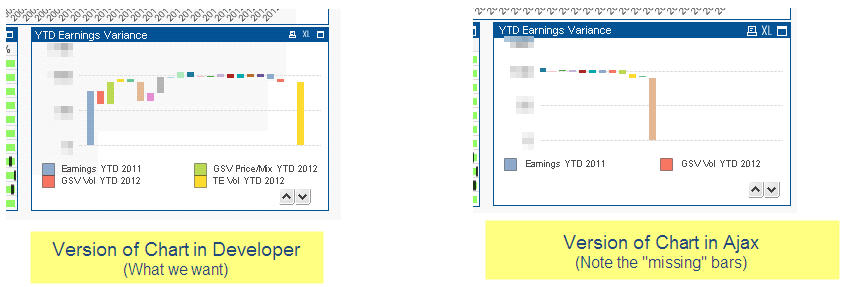
I have an issue where I have created a Bar Chart in Developer that has no dimensions, but 24 expressions. That is, each bar is a separate expression.
It looks fine when I view it in the Developer client, however when I open the same dashboard in the Web (via Plug-in and Ajax), I can only see half of the Bars. (i.e. bars 11 - 20). The first 10 are missing, and in fact, it looks like the whole thing has "shifted" to the left.
See the following (the one of the left is what we want, the one of the right is "missing" bars):
We are currently running Version 11 QlikView, and recently upgraded from version 9. The chart worked fine in Version 9.
Has anyone seen this behaviour before?
Thanks,
Adam
- Mark as New
- Bookmark
- Subscribe
- Mute
- Subscribe to RSS Feed
- Permalink
- Report Inappropriate Content
He Adam,
Sometimes it happens that your developer design differs from the web design (really annoying).
Does it also happen if you turn on the web view in the desktop version?
Try making the graph a little bit bigger (eg increase the width) and then check it again in the webview.
Hope this helps.