Unlock a world of possibilities! Login now and discover the exclusive benefits awaiting you.
- Qlik Community
- :
- All Forums
- :
- QlikView App Dev
- :
- Re: Difference between two dates
- Subscribe to RSS Feed
- Mark Topic as New
- Mark Topic as Read
- Float this Topic for Current User
- Bookmark
- Subscribe
- Mute
- Printer Friendly Page
- Mark as New
- Bookmark
- Subscribe
- Mute
- Subscribe to RSS Feed
- Permalink
- Report Inappropriate Content
Difference between two dates
I WANT TO SHOW THE DIFFERENCE BETWEEN THE TWO DATES (The FIRST Col - The SECOND Col) and plot their values on a bar chart.
How can that be done ?
Thanks
- Tags:
- qlikview_scripting
- « Previous Replies
-
- 1
- 2
- Next Replies »
- Mark as New
- Bookmark
- Subscribe
- Mute
- Subscribe to RSS Feed
- Permalink
- Report Inappropriate Content
Try this?
TimeStamp(Field1, 'MMM D YYYY hh:mmTT') - TimeStamp(Field2, 'MMM D YYYY hh:mmTT')
- Mark as New
- Bookmark
- Subscribe
- Mute
- Subscribe to RSS Feed
- Permalink
- Report Inappropriate Content
Hey ,
I tried this but it isn't working at all. shows no values.
- Mark as New
- Bookmark
- Subscribe
- Mute
- Subscribe to RSS Feed
- Permalink
- Report Inappropriate Content
Did you try Interval function.
- Mark as New
- Bookmark
- Subscribe
- Mute
- Subscribe to RSS Feed
- Permalink
- Report Inappropriate Content
Yes I did , But I couldn't fetch any results.
- Mark as New
- Bookmark
- Subscribe
- Mute
- Subscribe to RSS Feed
- Permalink
- Report Inappropriate Content
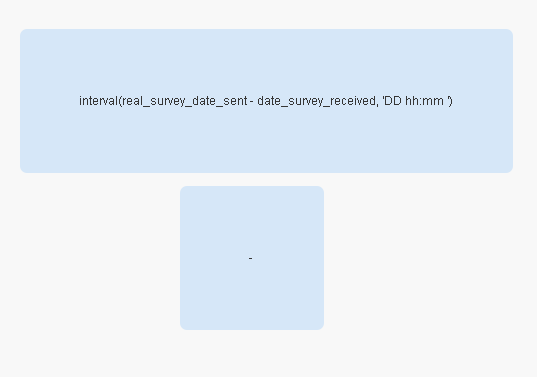
interval(Col1 - Col2, 'DD hh:mm ')
- Mark as New
- Bookmark
- Subscribe
- Mute
- Subscribe to RSS Feed
- Permalink
- Report Inappropriate Content
Tried that as well , 😕
- Mark as New
- Bookmark
- Subscribe
- Mute
- Subscribe to RSS Feed
- Permalink
- Report Inappropriate Content
If those are names of fields with multiple values, better create a straight table with a separate row for each value combination for real_survey_date_sent and date_survey_received, and add an expression with one of the suggestions posted before.
Specifying a field name in a text box will return all values at once. And subtracting all values from all values will lead to a NULL result.
- Mark as New
- Bookmark
- Subscribe
- Mute
- Subscribe to RSS Feed
- Permalink
- Report Inappropriate Content
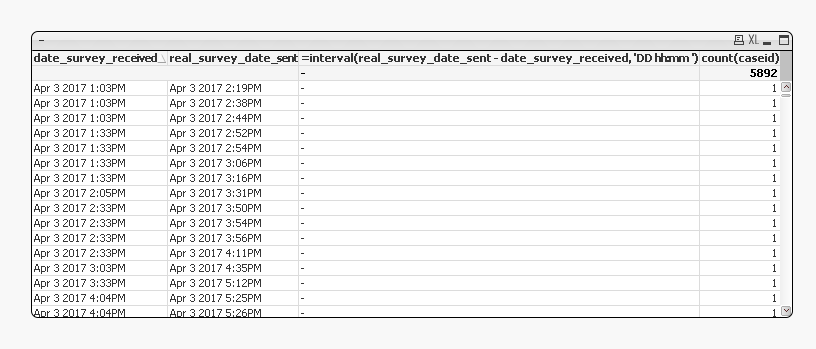
Tried this , but No values are shown.
- Mark as New
- Bookmark
- Subscribe
- Mute
- Subscribe to RSS Feed
- Permalink
- Report Inappropriate Content
Can you share image simply using
Date1 - Date2 ??
- « Previous Replies
-
- 1
- 2
- Next Replies »