Unlock a world of possibilities! Login now and discover the exclusive benefits awaiting you.
- Qlik Community
- :
- All Forums
- :
- QlikView App Dev
- :
- Difference in display between Qlikview desktop and...
- Subscribe to RSS Feed
- Mark Topic as New
- Mark Topic as Read
- Float this Topic for Current User
- Bookmark
- Subscribe
- Mute
- Printer Friendly Page
- Mark as New
- Bookmark
- Subscribe
- Mute
- Subscribe to RSS Feed
- Permalink
- Report Inappropriate Content
Difference in display between Qlikview desktop and server
Hello,
I am writing to you because I am worry about a difference of display in a graph between my QlikView application for development, and the QlikView dashboard view with QlikView server.
Here is my graph in QlikView desktop :
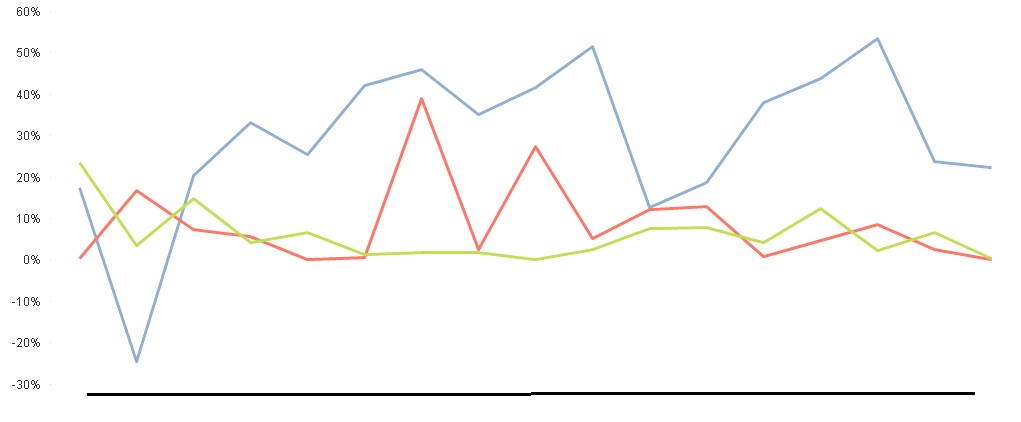
And here is my graph in a web browser with QlikView Server

We can see that, for the red line, a -1 and o 0 appears.
This red line correspond to an expression like :
=Count(If(COST=0 OR isnull(COST),[COST]))/COUNT(COST)
I already check "suppress null value".
Do you know from how can I hide this two values -1 and 0 ?
Thanks for your help 
Accepted Solutions
- Mark as New
- Bookmark
- Subscribe
- Mute
- Subscribe to RSS Feed
- Permalink
- Report Inappropriate Content
To begin with, make sure they're both using the exact same data set: source data and selections. The blue lines tell me this is not the case.
talk is cheap, supply exceeds demand
- Mark as New
- Bookmark
- Subscribe
- Mute
- Subscribe to RSS Feed
- Permalink
- Report Inappropriate Content
To begin with, make sure they're both using the exact same data set: source data and selections. The blue lines tell me this is not the case.
talk is cheap, supply exceeds demand
- Mark as New
- Bookmark
- Subscribe
- Mute
- Subscribe to RSS Feed
- Permalink
- Report Inappropriate Content
You're right, sorry... 
I have a trouble with my QVD. I will look for that.
Thanks.