Unlock a world of possibilities! Login now and discover the exclusive benefits awaiting you.
- Qlik Community
- :
- All Forums
- :
- QlikView App Dev
- :
- Different colors in a line chart?
- Subscribe to RSS Feed
- Mark Topic as New
- Mark Topic as Read
- Float this Topic for Current User
- Bookmark
- Subscribe
- Mute
- Printer Friendly Page
- Mark as New
- Bookmark
- Subscribe
- Mute
- Subscribe to RSS Feed
- Permalink
- Report Inappropriate Content
Different colors in a line chart?
Hi
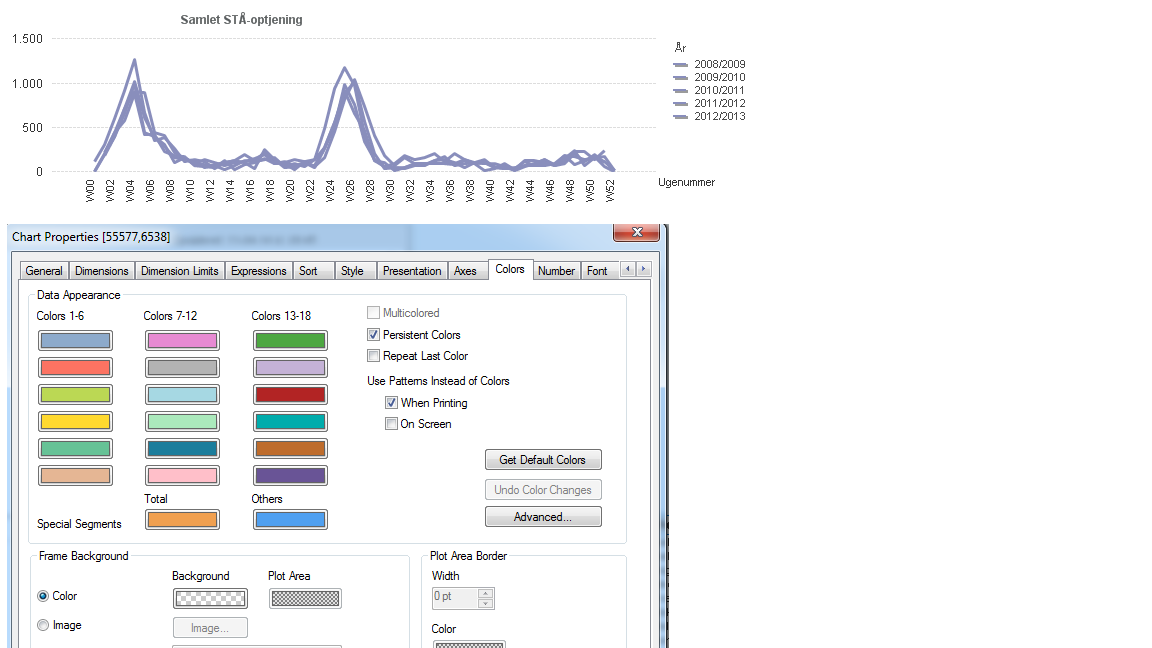
I have a problem with getting different colors of the curves in my line chart. They all have the same color, which is not very easy to look at.
I have tried different things in the colors tab in the properties menu, but I can't seem to find the mssing link.
Anybody can tell me?
Below is my chart and a cpoy of the colors tab.
Kind Regards Maria

Accepted Solutions
- Mark as New
- Bookmark
- Subscribe
- Mute
- Subscribe to RSS Feed
- Permalink
- Report Inappropriate Content
if you delete the background of your expression, what's happened ?
- Mark as New
- Bookmark
- Subscribe
- Mute
- Subscribe to RSS Feed
- Permalink
- Report Inappropriate Content
check the expression background weather any RGB is given .if it so mean remove that one
- Mark as New
- Bookmark
- Subscribe
- Mute
- Subscribe to RSS Feed
- Permalink
- Report Inappropriate Content
Hi maria,
I don't actually know why the colours are not different for you - they should be - the first colour in this palette should only be used for the first expression and so on...
I would, however, propose a different approach:
=> For the sake of simplicity, I follow a (self-made) internal standard here to never use the colours_tab, but always define expression_colours via the expression_properties (which you can expand by clicking on the + on the "expression" tab)
HTH
Best regards,
DataNibbler
P.S.: Nizam is probably right. Have you maybe just copied one expression over and over and then adapted it? - if so, any background_colour that was set in the expr_properties would have been copied of course - and those settings override anything you do on the "colours"_tab.
- Mark as New
- Bookmark
- Subscribe
- Mute
- Subscribe to RSS Feed
- Permalink
- Report Inappropriate Content
if you delete the background of your expression, what's happened ?
- Mark as New
- Bookmark
- Subscribe
- Mute
- Subscribe to RSS Feed
- Permalink
- Report Inappropriate Content
i think he is having 2 dimension ,if single color is initilized for single expression mean ,Then all the line will be in single color only
- Mark as New
- Bookmark
- Subscribe
- Mute
- Subscribe to RSS Feed
- Permalink
- Report Inappropriate Content
i dont think it is possible
What you can do is that you just write conditions for same expression as many times.
- Mark as New
- Bookmark
- Subscribe
- Mute
- Subscribe to RSS Feed
- Permalink
- Report Inappropriate Content
It worked! Now my curves are different colors. Nice.. ![]()
I believe I had the problem, because I have copied my former coworkers work and put in my own data set. So she must have made this setting.