Unlock a world of possibilities! Login now and discover the exclusive benefits awaiting you.
- Qlik Community
- :
- All Forums
- :
- QlikView App Dev
- :
- Different from Total Count table, and Total count ...
- Subscribe to RSS Feed
- Mark Topic as New
- Mark Topic as Read
- Float this Topic for Current User
- Bookmark
- Subscribe
- Mute
- Printer Friendly Page
- Mark as New
- Bookmark
- Subscribe
- Mute
- Subscribe to RSS Feed
- Permalink
- Report Inappropriate Content
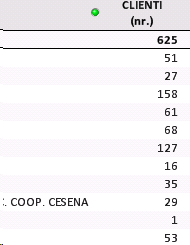
Different from Total Count table, and Total count for row
Hi, i have this problem my Total in my chart table on the top, is different from the total amouts in my rows... how can is possible?
if i put it on excel and i count the column it say me 626, but qlikview say me 625.
i attach the file, my set analisys in this colum is:
Count(DISTINCT {<DATA_IN={"<=$(=Date($(vFineMonthContrMaxMonth), 'DD/MM/YYYY'))"},DATA_OUT={">$(=Date($(vFineMonthContrMaxMonth), 'DD/MM/YYYY'))"}>} COD_CLIENTE)
where the variable $(vFineMonthContrMaxMonth) is 31/07/2019
what is wrong?
- Mark as New
- Bookmark
- Subscribe
- Mute
- Subscribe to RSS Feed
- Permalink
- Report Inappropriate Content
Nothing is wrong. You count distinct customers. It seems you have customers that are counted in the numbers of more than one detail row of your table. They're unique per row, but not unique over all rows so summing the totals of the rows gives you a larger number than the unique number of customers overall.
If you want to sum the distinct counts of the rows then you should either do another level of aggregation or set the total mode of the chart expression to sum instead automatic.
The sum of counts can be calculated with something like sum(aggr( count(....etc) , dimA, DimB, ...etc )). Where dimA, DimB, ...etc are the names of the fields you used a dimensions in your chart.
talk is cheap, supply exceeds demand
- Mark as New
- Bookmark
- Subscribe
- Mute
- Subscribe to RSS Feed
- Permalink
- Report Inappropriate Content
Sorry but i not understand what you mean,can you do the example with my set analisys i sent, for count well?
Thanks
- Mark as New
- Bookmark
- Subscribe
- Mute
- Subscribe to RSS Feed
- Permalink
- Report Inappropriate Content
Sum(aggr(Count(DISTINCT {<DATA_IN={"<=$(=Date($(vFineMonthContrMaxMonth), 'DD/MM/YYYY'))"},DATA_OUT={">$(=Date($(vFineMonthContrMaxMonth), 'DD/MM/YYYY'))"}>} COD_CLIENTE),dimA,DimB,...etc))
talk is cheap, supply exceeds demand
- Mark as New
- Bookmark
- Subscribe
- Mute
- Subscribe to RSS Feed
- Permalink
- Report Inappropriate Content
Thanks, but my dimension are not always the same, i use a Group cycle.
Before you wrote this too: "or set the total mode of the chart expression to sum instead automatic" how?
- Mark as New
- Bookmark
- Subscribe
- Mute
- Subscribe to RSS Feed
- Permalink
- Report Inappropriate Content
Open the Expressions tab of the properties window of the chart. Select your expression in the list and change the Total Mode from Expression Total to Sum (of Rows)
talk is cheap, supply exceeds demand
- Mark as New
- Bookmark
- Subscribe
- Mute
- Subscribe to RSS Feed
- Permalink
- Report Inappropriate Content
And this it will do the aggregation in automatic?
Otherwise if i want to do with your set analisys you wrote, what i need to put in Dim1, Dim2... if i use ony a Dimension but it is a Cycle Group, so it can change ?
thanks
- Mark as New
- Bookmark
- Subscribe
- Mute
- Subscribe to RSS Feed
- Permalink
- Report Inappropriate Content
Hi, sorry but i think is a problem in your solution, becouse look at this attachment: you see i have 2 different value in my 2 tables.
In the first i have 3.381.185 this is a chart table with this expression:
Sum(DISTINCT {<DATA_IN={"=Aggr(Max(DATA_IN), MESEIN, COD_PUNTO)"}>}if(Num(Interval(DATA_OUT-DATA_IN,'DD'))>2, CONSUMO_TOT_ANNUO))
and setting the total amount in the chart like you said. The dimensions are three
In the second tabe i have the same expression with the same total amout setting, but i obtain a different value: 3.357.609
in this second table i have a cycle group for dimensions
If i use the set analisys like you said, for example in this case in my second table :
Sum(aggr(Sum(DISTINCT {<DATA_IN={"=Aggr(Max(DATA_IN), MESEIN, COD_PUNTO)"}>}if(Num(Interval(DATA_OUT-DATA_IN,'DD'))>2, CONSUMO_TOT_ANNUO)),AGENTE)) i obtain another result, and if i put for dimension the other in the cycle group... i obtain another result......
So... what is the right way?
I need only to Sum a distinct of values.....
- Mark as New
- Bookmark
- Subscribe
- Mute
- Subscribe to RSS Feed
- Permalink
- Report Inappropriate Content
Daniele, what is most helpful in these situations is for you to attach the QVW file, as this lets folks see the data model as well as all the objects and expressions, so they can figure out exactly what you have done in relation to what you are trying to do. Best recommendation I can give you if you are still looking for help. If you have fields that you are worried about folks seeing values, use the Settings\Document Properties\Scrambling tab to scramble those field values of concern before attaching to the post. A sample app with sample data showing things also works.
Regards,
Brett
I now work a compressed schedule, Tuesday, Wednesday and Thursday, so those will be the days I will reply to any follow-up posts.