Unlock a world of possibilities! Login now and discover the exclusive benefits awaiting you.
- Qlik Community
- :
- All Forums
- :
- QlikView App Dev
- :
- Different way of showing Line Graph
Options
- Subscribe to RSS Feed
- Mark Topic as New
- Mark Topic as Read
- Float this Topic for Current User
- Bookmark
- Subscribe
- Mute
- Printer Friendly Page
Turn on suggestions
Auto-suggest helps you quickly narrow down your search results by suggesting possible matches as you type.
Showing results for
Not applicable
2014-11-24
06:03 PM
- Mark as New
- Bookmark
- Subscribe
- Mute
- Subscribe to RSS Feed
- Permalink
- Report Inappropriate Content
Different way of showing Line Graph
Hi,
I have the following chart which shows the number of visitors at certain hours of the day from midnight to midnight
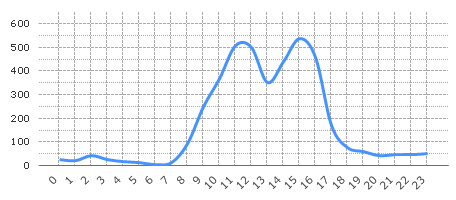
And have been trying to think of a more visual way to show this.. Is it possible to show the Hours and dynamically change the size of the hours depending on the value?
Ive mocked up something in photoshop which tries to mimic the above chart :

Is there a way to achieve this in QV?
many thanks,
Tom
- Tags:
- chart
- visualisation
375 Views
0 Replies