Unlock a world of possibilities! Login now and discover the exclusive benefits awaiting you.
- Qlik Community
- :
- All Forums
- :
- QlikView App Dev
- :
- Re: Different year value in a single bar with diff...
- Subscribe to RSS Feed
- Mark Topic as New
- Mark Topic as Read
- Float this Topic for Current User
- Bookmark
- Subscribe
- Mute
- Printer Friendly Page
- Mark as New
- Bookmark
- Subscribe
- Mute
- Subscribe to RSS Feed
- Permalink
- Report Inappropriate Content
Different year value in a single bar with different color
hello everyone,
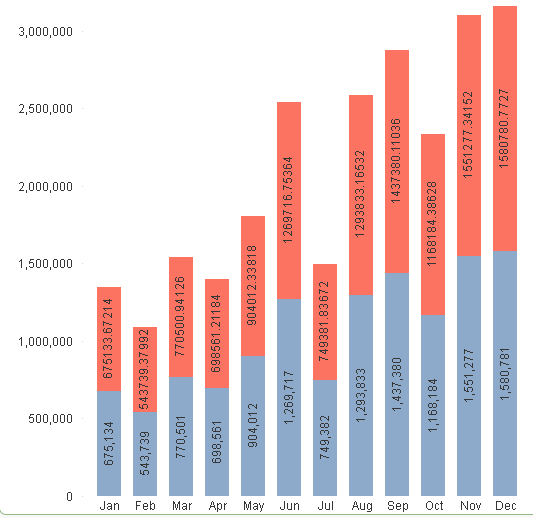
i have below chart, which is contain monthly sale
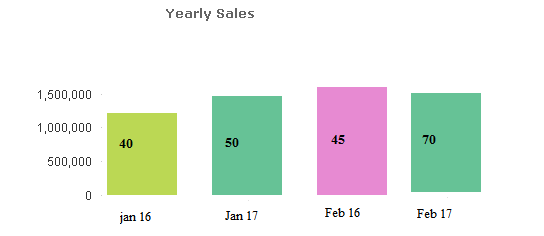
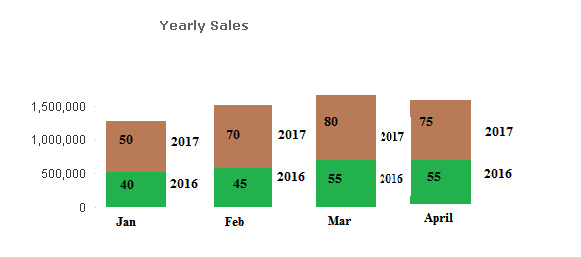
but i want show like below,means in a single bar it will show only jan's 16 and 17 sales(no need to show year in chart) data with two different color how it will be possible?
Thank You.
- Mark as New
- Bookmark
- Subscribe
- Mute
- Subscribe to RSS Feed
- Permalink
- Report Inappropriate Content
i already done this.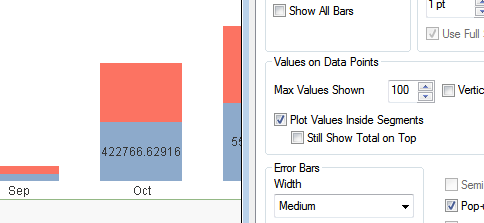
- Mark as New
- Bookmark
- Subscribe
- Mute
- Subscribe to RSS Feed
- Permalink
- Report Inappropriate Content
please share a screenshot, i am not able to read qvw
- Mark as New
- Bookmark
- Subscribe
- Mute
- Subscribe to RSS Feed
- Permalink
- Report Inappropriate Content
Have you enable the "Data points" for each expression?
- Mark as New
- Bookmark
- Subscribe
- Mute
- Subscribe to RSS Feed
- Permalink
- Report Inappropriate Content
yes
- Mark as New
- Bookmark
- Subscribe
- Mute
- Subscribe to RSS Feed
- Permalink
- Report Inappropriate Content
Hi,
Refer,
Fact:
load *, Year(Date) as Year,Month(Date) as Month,Date(Date,'MMM-YY') as MonthYear;
LOAD * INLINE [
    Date, Sales
    31/1/2016, 40
    31/1/2017, 50
    20/2/2016, 45
    28/2/2017, 70
];
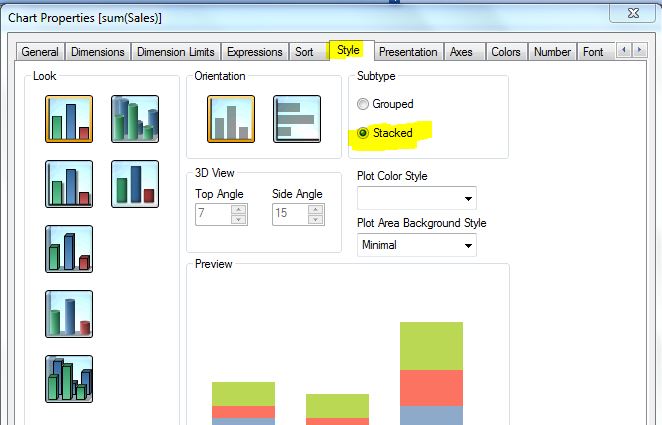
Bar chart->Style tab->Subtype 'Stacked'
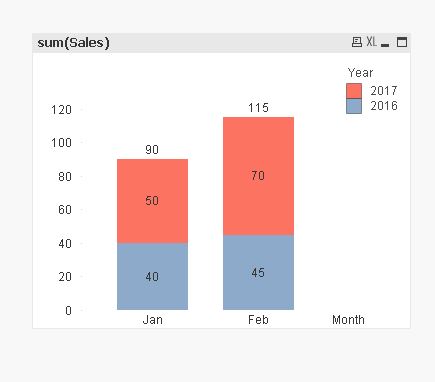
try to create bar chart as like below way
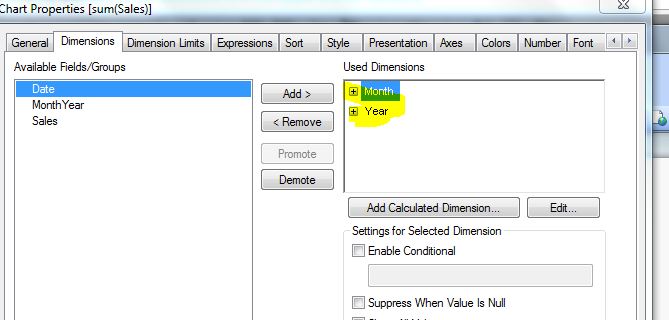
1st dimension in your bar chart: Month &
add Year as 2nd dimension
expression;
sum(Sales)
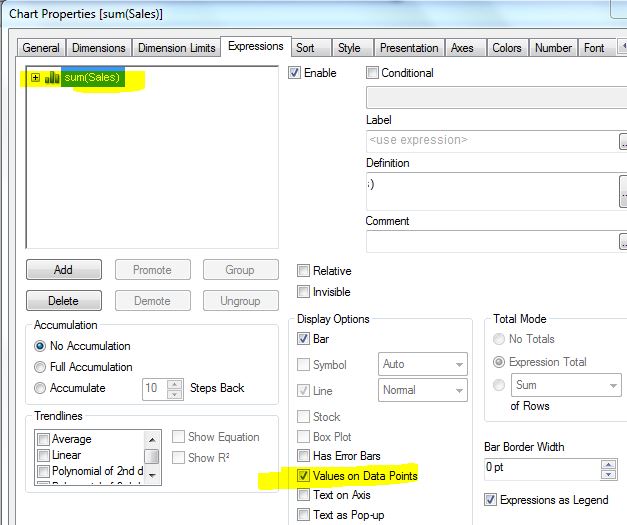
after that enable data points for this expression tab
right clik your chart object and go to chart properties -->style--> subtype as Stacked
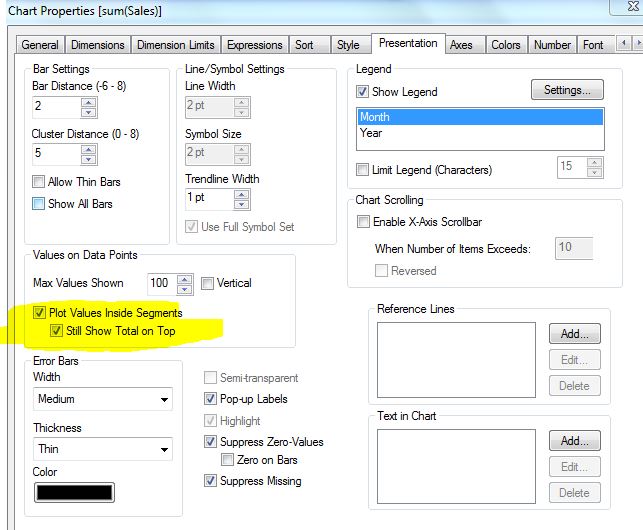
and then go to presentation enable check box as "Plot values inside segments"
- Mark as New
- Bookmark
- Subscribe
- Mute
- Subscribe to RSS Feed
- Permalink
- Report Inappropriate Content
Can you attach QVW which demonstrates the O/P 
- Mark as New
- Bookmark
- Subscribe
- Mute
- Subscribe to RSS Feed
- Permalink
- Report Inappropriate Content
please find attach file
- Mark as New
- Bookmark
- Subscribe
- Mute
- Subscribe to RSS Feed
- Permalink
- Report Inappropriate Content
but i need to show two different year and their same month in single bar
- Mark as New
- Bookmark
- Subscribe
- Mute
- Subscribe to RSS Feed
- Permalink
- Report Inappropriate Content
Your values not showing because Height issue. You need to rid that using increase the height or showing in % values
- Mark as New
- Bookmark
- Subscribe
- Mute
- Subscribe to RSS Feed
- Permalink
- Report Inappropriate Content
it shows for only 2016 and 2017 but i have many years