Unlock a world of possibilities! Login now and discover the exclusive benefits awaiting you.
- Qlik Community
- :
- All Forums
- :
- QlikView App Dev
- :
- Re: Dimension in Expression
- Subscribe to RSS Feed
- Mark Topic as New
- Mark Topic as Read
- Float this Topic for Current User
- Bookmark
- Subscribe
- Mute
- Printer Friendly Page
- Mark as New
- Bookmark
- Subscribe
- Mute
- Subscribe to RSS Feed
- Permalink
- Report Inappropriate Content
Dimension in Expression
Hi,
I have a simple bar graph illustrating the following formula:
=(only({<Companyname,Year={$(vYEAR3)}>}[Data])
-only({<Companyname,Year={$(=(vYEAR3)-1)}>}[Data]))
/(only({<Companyname,Year={$(vYEAR3)}>}[Data]))
I am using a fader for the variable.
However, I do have other bar graphs showing data for the dimension year.
How can I use such a dimension in the metioned formula to get graphical results for all available years?
Data looks like the following:
| Companyname | Year | Data |
|---|---|---|
| aaa | 2014 | 325 |
| aaa | 2013 | 321 |
| aaa | 2012 | 231 |
| bbb | 2014 | 111 |
| bbb | 2013 | 222 |
| bbb | 2012 | 333 |
Cheers!
Accepted Solutions
- Mark as New
- Bookmark
- Subscribe
- Mute
- Subscribe to RSS Feed
- Permalink
- Report Inappropriate Content
Try this:
(Only({<Companyname>} Data) - Above(Only({<Companyname>} Data)))/Only({<Companyname>} Data)
or
(Only({<Companyname>} Data) - Below(Only({<Companyname>} Data)))/Only({<Companyname>} Data)
You might have to play around with the sorting, but I think one of these should work
- Mark as New
- Bookmark
- Subscribe
- Mute
- Subscribe to RSS Feed
- Permalink
- Report Inappropriate Content
Didn't understand the requirement, Can you elaborate your dimension, measure and share the output image you need to create.
It seems you want to modify the given expression in some way but not sure what exactly you need.
- Mark as New
- Bookmark
- Subscribe
- Mute
- Subscribe to RSS Feed
- Permalink
- Report Inappropriate Content
What is your dimension here? or are you doing this in a text box object?
- Mark as New
- Bookmark
- Subscribe
- Mute
- Subscribe to RSS Feed
- Permalink
- Report Inappropriate Content
That is what I´ve got and happy with:
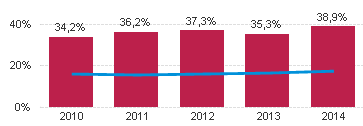
with bars beeing =only({$<Companyname=xxx>}[data])
with line beeing =avg([data])
In chart properties I have added "year" under dimensions.
I just dont know the general expression to get a value like this for bar 2014:
=(only({<Companyname,Year={2014}>}[Data])
-only({<Companyname,Year={2013}>}[Data]))
/(only({<Companyname,Year={2014)}>}[Data]))
Tried "Max(Year)", but didn´t work...
- Mark as New
- Bookmark
- Subscribe
- Mute
- Subscribe to RSS Feed
- Permalink
- Report Inappropriate Content
Try this:
(Only({<Companyname>} Data) - Above(Only({<Companyname>} Data)))/Only({<Companyname>} Data)
or
(Only({<Companyname>} Data) - Below(Only({<Companyname>} Data)))/Only({<Companyname>} Data)
You might have to play around with the sorting, but I think one of these should work
- Mark as New
- Bookmark
- Subscribe
- Mute
- Subscribe to RSS Feed
- Permalink
- Report Inappropriate Content
Good work, thanks!
Anyway, one visual problem left.
Referring to the above chart, when I am clicking on one bar that year will show up, clicking on it again I see the whole chart again.
That doesn´t work when using your expressions. It says no data available.
- Mark as New
- Bookmark
- Subscribe
- Mute
- Subscribe to RSS Feed
- Permalink
- Report Inappropriate Content
May be try this:
(Only({<Companyname>} Data) -
If(Only({<Companyname>} Data) > 0, Above(Only({<Companyname, Year>} Data)))
)/Only({<Companyname>} Data)
- Mark as New
- Bookmark
- Subscribe
- Mute
- Subscribe to RSS Feed
- Permalink
- Report Inappropriate Content
(Only({<Companyname>} Data) -
Above(Only({<Companyname, Year>} Data))
)/Only({<Companyname>} Data)
That worked out, thanks!
- Mark as New
- Bookmark
- Subscribe
- Mute
- Subscribe to RSS Feed
- Permalink
- Report Inappropriate Content
Well, is that not working for different data?
Like:
(Only({<Companyname>} DataX) -
Above(Only({<Companyname, Year>} DataY))
)/Only({<Companyname>} DataZ)
- Mark as New
- Bookmark
- Subscribe
- Mute
- Subscribe to RSS Feed
- Permalink
- Report Inappropriate Content
Difficult to say what might be the reason. May be there are more than one values and you need to use Sum instead of Only?
=(Sum({<Companyname>} DataX) - Above(Sum({<Companyname, Year>} DataY))/Sum({<Companyname>} DataZ)