Unlock a world of possibilities! Login now and discover the exclusive benefits awaiting you.
- Qlik Community
- :
- All Forums
- :
- QlikView App Dev
- :
- Dimension with Set Analysis expression
- Subscribe to RSS Feed
- Mark Topic as New
- Mark Topic as Read
- Float this Topic for Current User
- Bookmark
- Subscribe
- Mute
- Printer Friendly Page
- Mark as New
- Bookmark
- Subscribe
- Mute
- Subscribe to RSS Feed
- Permalink
- Report Inappropriate Content
Dimension with Set Analysis expression
Hi folks,
I have a funnel chart where the dimension is a 'Status' and the expression is a count by ID using set analysis, like this:
=Count( {$< Status= {"AAAAAA", "BBBBBB", "CCCCCC"} > } Id)
The chart is:
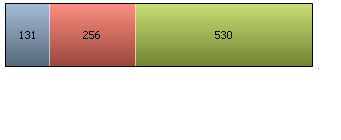
But... when I click in the blue colour on the chart, the chart is static...
All the dimensions around the sheet has changed... but the graph is the same.
I would like when I click on blue (represented by "AAAAAAA" status) the chart sould be:
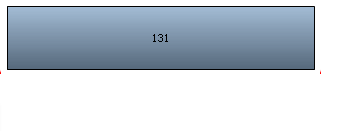
How do I do that?
Thanks,
Rodrigo.
- Tags:
- new_to_qlikview
Accepted Solutions
- Mark as New
- Bookmark
- Subscribe
- Mute
- Subscribe to RSS Feed
- Permalink
- Report Inappropriate Content
Like this:
count({<Status*={'AAAAAA','BBBBBB','CCCCCC'}>} Id)
The *= is what's doing the work. When you just use =, you're saying "exactly these values, no matter what I select". When you use *=, you're saying "the intersection of what I've selected in Status and these values". I probably use *= more often than = because I'm trying to limit the selections, not override the selections.
- Mark as New
- Bookmark
- Subscribe
- Mute
- Subscribe to RSS Feed
- Permalink
- Report Inappropriate Content
Perfect!!
Thank you!!!
Regards,
Rodrigo.