Unlock a world of possibilities! Login now and discover the exclusive benefits awaiting you.
- Qlik Community
- :
- All Forums
- :
- QlikView App Dev
- :
- Re: Display Bar chart aggregated by two dimensions...
- Subscribe to RSS Feed
- Mark Topic as New
- Mark Topic as Read
- Float this Topic for Current User
- Bookmark
- Subscribe
- Mute
- Printer Friendly Page
- Mark as New
- Bookmark
- Subscribe
- Mute
- Subscribe to RSS Feed
- Permalink
- Report Inappropriate Content
Display Bar chart aggregated by two dimensions/fields
Hi Guys,
I need to display the data of the Straight Table below in the form of a Chart like above.
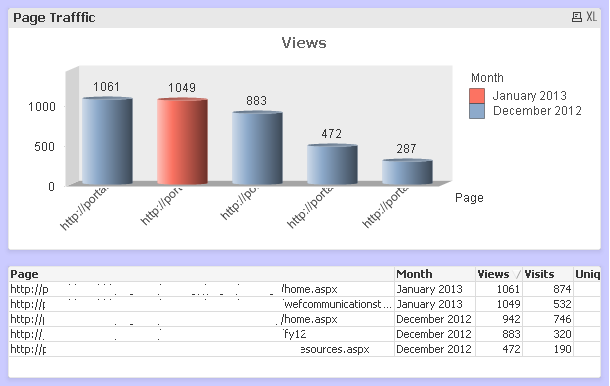
For Chart, I put Dimensions as 'Page' and 'Month' with Dimension Limit 5, and Expression as [aggr(max(Views),Page)].
But here as you can see, the third row in the table is missing in the bar chart. ie. it obviously does not consoider HOME PAGE again for the month
December 2012. I need all the views including 'December 2012 --> 942 '
Please help.
Thanks!!
- Mark as New
- Bookmark
- Subscribe
- Mute
- Subscribe to RSS Feed
- Permalink
- Report Inappropriate Content
Without actual qvw file it is hard to analyize your issue.. but still
Try this:
1. Try to remove the dimension limits and see if the 942 fig is coming or not.
2. also take a copy of your table and remove extra expressions like Visits,uniq..etc.. just keep views in your table..
then go to chart property and change the chart type to Bar chart...
Then see if the 942 fig is coming or not...
if it is possible for you to post sample data or qvw file then it would be easy to debug your issue.
HTH
Sushil
- Mark as New
- Bookmark
- Subscribe
- Mute
- Subscribe to RSS Feed
- Permalink
- Report Inappropriate Content
Hi,
Have a look at the attached example.
Is this what you want?
Regards,
Kaushik Solanki