Unlock a world of possibilities! Login now and discover the exclusive benefits awaiting you.
- Qlik Community
- :
- All Forums
- :
- QlikView App Dev
- :
- Display Color Button
- Subscribe to RSS Feed
- Mark Topic as New
- Mark Topic as Read
- Float this Topic for Current User
- Bookmark
- Subscribe
- Mute
- Printer Friendly Page
- Mark as New
- Bookmark
- Subscribe
- Mute
- Subscribe to RSS Feed
- Permalink
- Report Inappropriate Content
Display Color Button
Dear all
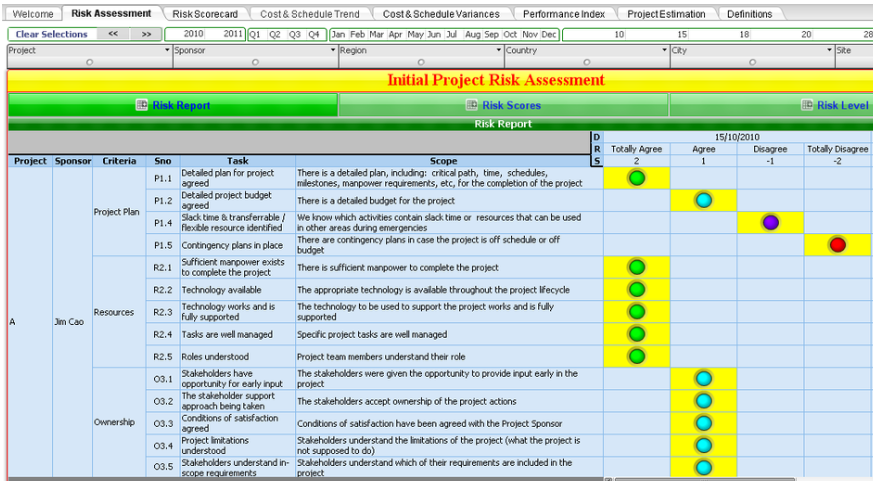
I found an interesting page in www.360globalconsulting.com under Products-Project and was told that they designed using Qlikview BI Tool.
Can someone advise me how to display colour button shown in attached file ?.
Thank you
Tracy
- Mark as New
- Bookmark
- Subscribe
- Mute
- Subscribe to RSS Feed
- Permalink
- Report Inappropriate Content
I think with
representation image in chart expression
then in edit expression go to Images tab and choose the image
- Mark as New
- Bookmark
- Subscribe
- Mute
- Subscribe to RSS Feed
- Permalink
- Report Inappropriate Content
Are you asking about Tabs?
- Mark as New
- Bookmark
- Subscribe
- Mute
- Subscribe to RSS Feed
- Permalink
- Report Inappropriate Content
Dear Massimo
Not bar, it is a colourful button / dot.
Thanks
Tracy
- Mark as New
- Bookmark
- Subscribe
- Mute
- Subscribe to RSS Feed
- Permalink
- Report Inappropriate Content
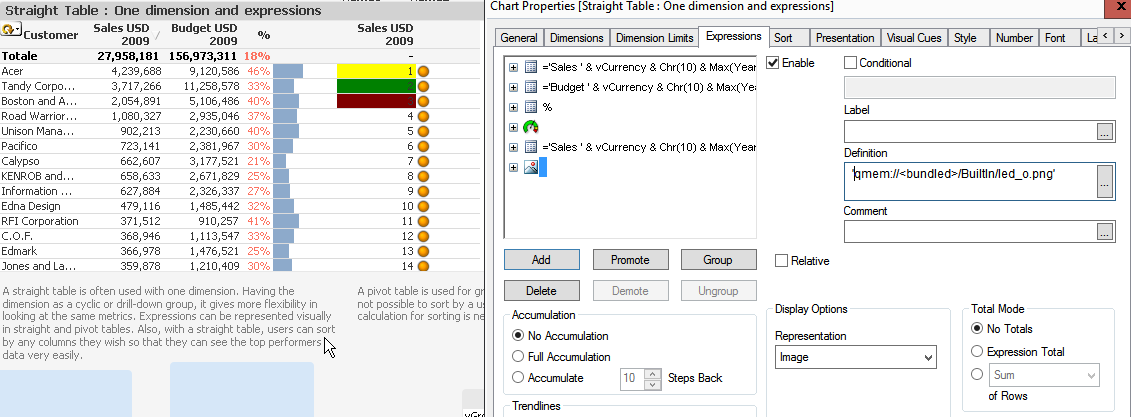
last column in my image is a dot
you can choose the color of the dot adding an if (image), i.e.
if(odd(RowNo(TOTAL)),
'qmem://<bundled>/BuiltIn/led_o.png',
'qmem://<bundled>/BuiltIn/led_g.png'
)
replace the bold with your condition
if(sum(....) > ...., 'qmem://<bundled>/BuiltIn/led_o.png',
if(sum(....) > ...., 'qmem://<bundled>/BuiltIn/led_g.png',
if(sum(....) > ...., 'qmem://<bundled>/BuiltIn/led_r.png',
.....
)))
- Mark as New
- Bookmark
- Subscribe
- Mute
- Subscribe to RSS Feed
- Permalink
- Report Inappropriate Content
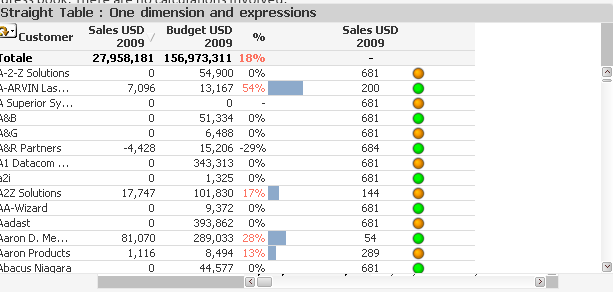
Dear Massimo
Not sure how to do it. Can your script display the same answer as the image below ?.
Thanks, Tracy