Unlock a world of possibilities! Login now and discover the exclusive benefits awaiting you.
- Qlik Community
- :
- All Forums
- :
- QlikView
- :
- Display data conditionally in Table Box
- Subscribe to RSS Feed
- Mark Topic as New
- Mark Topic as Read
- Float this Topic for Current User
- Bookmark
- Subscribe
- Mute
- Printer Friendly Page
- Mark as New
- Bookmark
- Subscribe
- Mute
- Subscribe to RSS Feed
- Permalink
- Report Inappropriate Content
Display data conditionally in Table Box
Hi All,
How can i display data conditionally in Table box only. For example Dims are Year, Qtr and Month.
Condition should be Year =2016.
Thanks,
Nihhal.
- « Previous Replies
-
- 1
- 2
- Next Replies »
- Mark as New
- Bookmark
- Subscribe
- Mute
- Subscribe to RSS Feed
- Permalink
- Report Inappropriate Content
in Table Box you can use Conditional Show of the Table like:
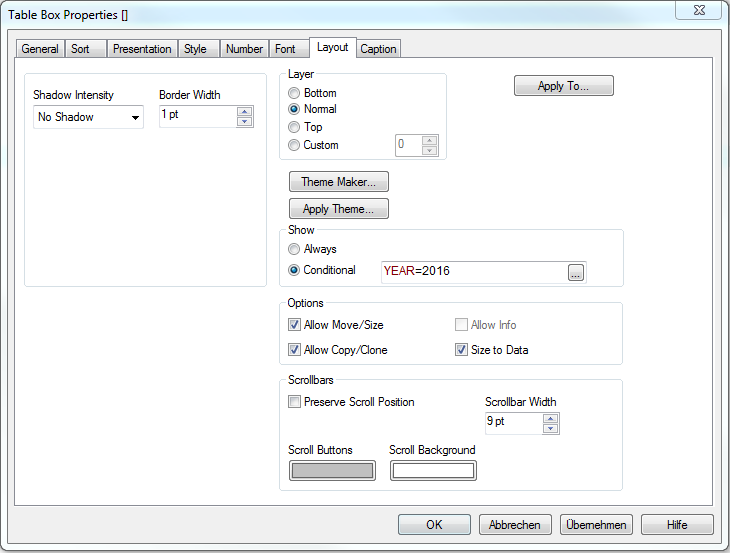
If you want to Show columns via condition you have to use the table Chart object
- Mark as New
- Bookmark
- Subscribe
- Mute
- Subscribe to RSS Feed
- Permalink
- Report Inappropriate Content
Hi
if(GetFieldSelections(Year)<>null())
or
if(GetFieldSelections(year)=2016)
- Mark as New
- Bookmark
- Subscribe
- Mute
- Subscribe to RSS Feed
- Permalink
- Report Inappropriate Content
Within a tablebox are no conditions possible (whereby a simply select of 2016 will be enough). But you could use a straight table for it which could be apply conditions.
Not very nice but possible would be you creates a flag on the year 2016 within your data and all other data for these flag are NULL - now you could include these flag-field into your table-box and enable for this field the hide NULL option within the tab presentation.
- Marcus
- Mark as New
- Bookmark
- Subscribe
- Mute
- Subscribe to RSS Feed
- Permalink
- Report Inappropriate Content
You can hide the whole text box object by using this condition
=SubStringCount(Concat(DISTINCT Year, '|'), 2016) = 1
Or you can show blank using this expression on the Main Tab
=If(SubStringCount(Concat(DISTINCT Year, '|'), 2016) = 1, YourExpression)
- Mark as New
- Bookmark
- Subscribe
- Mute
- Subscribe to RSS Feed
- Permalink
- Report Inappropriate Content
Can we write this in Table box. I think it is not possible.
- Mark as New
- Bookmark
- Subscribe
- Mute
- Subscribe to RSS Feed
- Permalink
- Report Inappropriate Content
Hi,
use straight table.
Regards
Please appreciate our Qlik community members by giving Kudos for sharing their time for your query. If your query is answered, please mark the topic as resolved 🙂
- Mark as New
- Bookmark
- Subscribe
- Mute
- Subscribe to RSS Feed
- Permalink
- Report Inappropriate Content
Not to the table box object. But you can do it to Pivot or Straight table
- Mark as New
- Bookmark
- Subscribe
- Mute
- Subscribe to RSS Feed
- Permalink
- Report Inappropriate Content
Is there a particular reason you wish to use a table box, rather than the more suitable straight table?
- Mark as New
- Bookmark
- Subscribe
- Mute
- Subscribe to RSS Feed
- Permalink
- Report Inappropriate Content
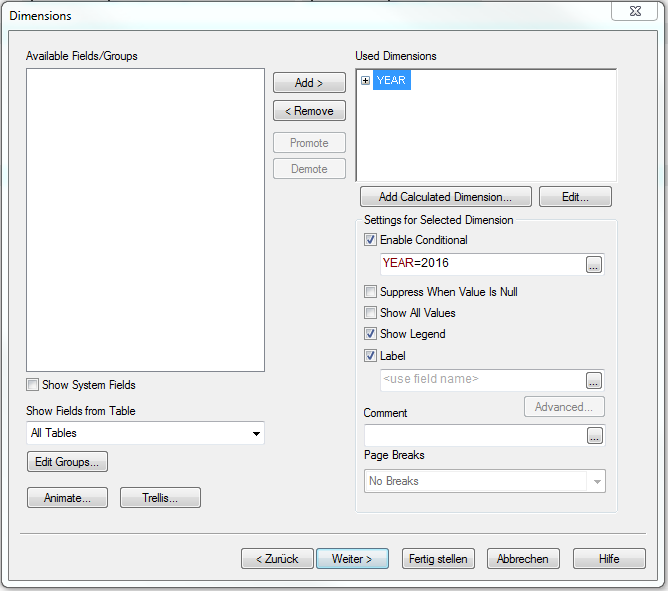
If i where you i would do the following:
-Use straight table instead of table box
-Add all the fields you want to display as dimensions
-Add one expression with set analysis like this: =SUM({<Year={2016}> 1}
-In the presentation tab (straight table properties), hide the expression column created in the previous step
You will now have a table with your data filtered
Important: you can replace the hard-coded 2016 year in the expression with year(today(1)) or something like that to add some dynamism.
Please let me know if this helps.
Kind regards,
- « Previous Replies
-
- 1
- 2
- Next Replies »