Unlock a world of possibilities! Login now and discover the exclusive benefits awaiting you.
- Qlik Community
- :
- All Forums
- :
- QlikView App Dev
- :
- Re: Display diagonal line when only one point is s...
- Subscribe to RSS Feed
- Mark Topic as New
- Mark Topic as Read
- Float this Topic for Current User
- Bookmark
- Subscribe
- Mute
- Printer Friendly Page
- Mark as New
- Bookmark
- Subscribe
- Mute
- Subscribe to RSS Feed
- Permalink
- Report Inappropriate Content
Display diagonal line when only one point is selected
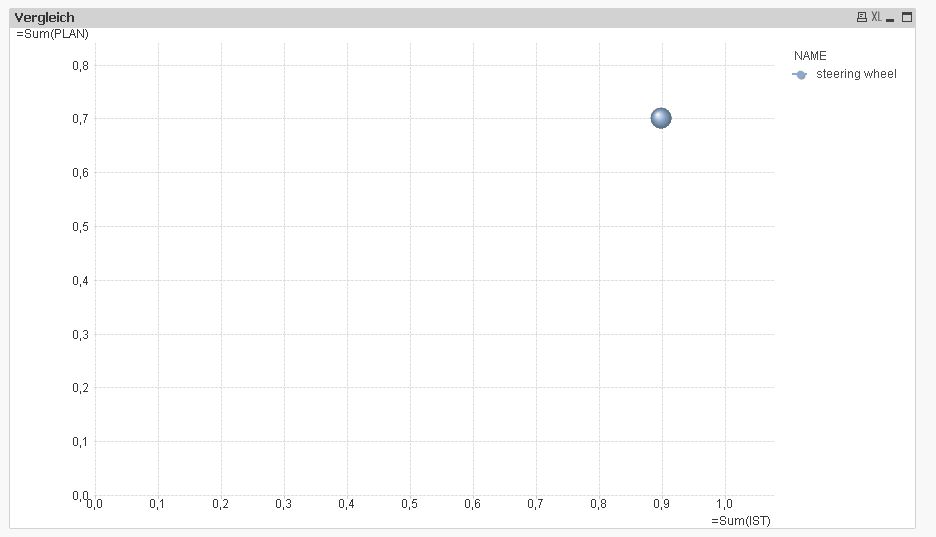
I have a graph like this:

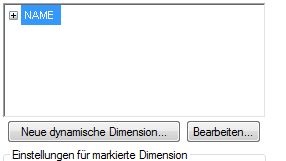
This is my dimension tab:
This is my expression tab:
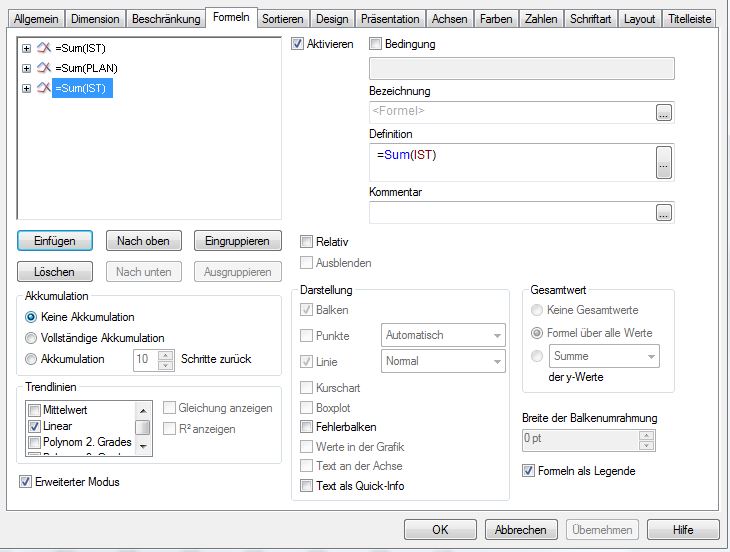
The third dimension is there to create the diagonal line (see the linear reference at the bottom left in my expression tab). I got the idea from here (Reference Line)!
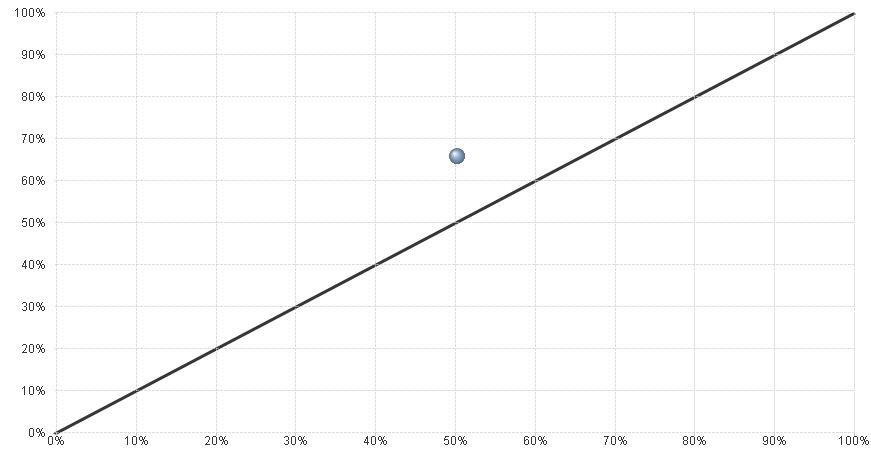
When I select only one point in the graph the line disappears (see below). But I want it to remain there. Other solutions to display a diagonal line are welcome too. Thanks for the help!!
Accepted Solutions
- Mark as New
- Bookmark
- Subscribe
- Mute
- Subscribe to RSS Feed
- Permalink
- Report Inappropriate Content
My workaround is to create a second scatter chart which will only show up when only one entity is selected. Then make the background of that scatter chart transparent and add a diagonal line object. You need also to fix the axis both to 100%.
- Mark as New
- Bookmark
- Subscribe
- Mute
- Subscribe to RSS Feed
- Permalink
- Report Inappropriate Content
Hello,
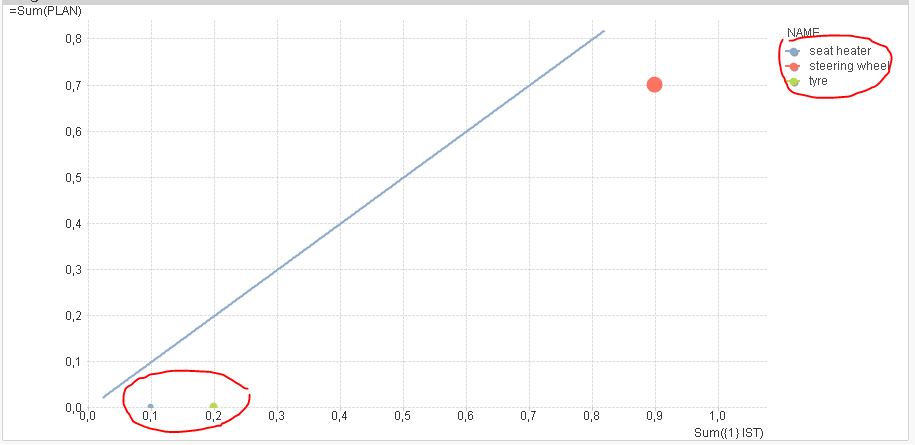
Try Sum({1} IST) instead of Sum(IST).
regards
Tim
- Mark as New
- Bookmark
- Subscribe
- Mute
- Subscribe to RSS Feed
- Permalink
- Report Inappropriate Content
Nice idea but unfortunately the not selected points stay in the graph (see below):

- Mark as New
- Bookmark
- Subscribe
- Mute
- Subscribe to RSS Feed
- Permalink
- Report Inappropriate Content
My workaround is to create a second scatter chart which will only show up when only one entity is selected. Then make the background of that scatter chart transparent and add a diagonal line object. You need also to fix the axis both to 100%.
- Mark as New
- Bookmark
- Subscribe
- Mute
- Subscribe to RSS Feed
- Permalink
- Report Inappropriate Content
There is also the possibility to make those points at the bottom transparent and then it will look like that it works. The only two drawbacks are the performance because the selection stays the same and the legend still shows the not selected points but in grey color.