Unlock a world of possibilities! Login now and discover the exclusive benefits awaiting you.
- Qlik Community
- :
- All Forums
- :
- QlikView App Dev
- :
- Display overlapping data only
- Subscribe to RSS Feed
- Mark Topic as New
- Mark Topic as Read
- Float this Topic for Current User
- Bookmark
- Subscribe
- Mute
- Printer Friendly Page
- Mark as New
- Bookmark
- Subscribe
- Mute
- Subscribe to RSS Feed
- Permalink
- Report Inappropriate Content
Display overlapping data only
Good Day,
I am trying to create a table that would display overlapping data ONLY. I have multiple companies selling similar products. I want to display in a table only the products that are being sold by both companies.
Data example:
| Company | Product | On Hand |
|---|---|---|
| Comp1 | A | 12 |
| Comp1 | B | 2 |
| Comp1 | C | 4 |
| Comp2 | A | 30 |
| Comp3 | B | 1 |
| Comp3 | D | 22 |
My Reporting Table should then look like this:
| Company | Product | On Hand |
|---|---|---|
| Comp1 | A | 12 |
| Comp2 | A | 30 |
| Comp1 | B | 2 |
| Comp3 | B | 22 |
Any help would be greatly appreciated.
Thanks,
Wynand.
- Tags:
- new_to_qlikview
- Mark as New
- Bookmark
- Subscribe
- Mute
- Subscribe to RSS Feed
- Permalink
- Report Inappropriate Content
not very clear what you need.
you have 3 companies in the table and there is no product that all 3 of them sell.
Please clarify
- Mark as New
- Bookmark
- Subscribe
- Mute
- Subscribe to RSS Feed
- Permalink
- Report Inappropriate Content
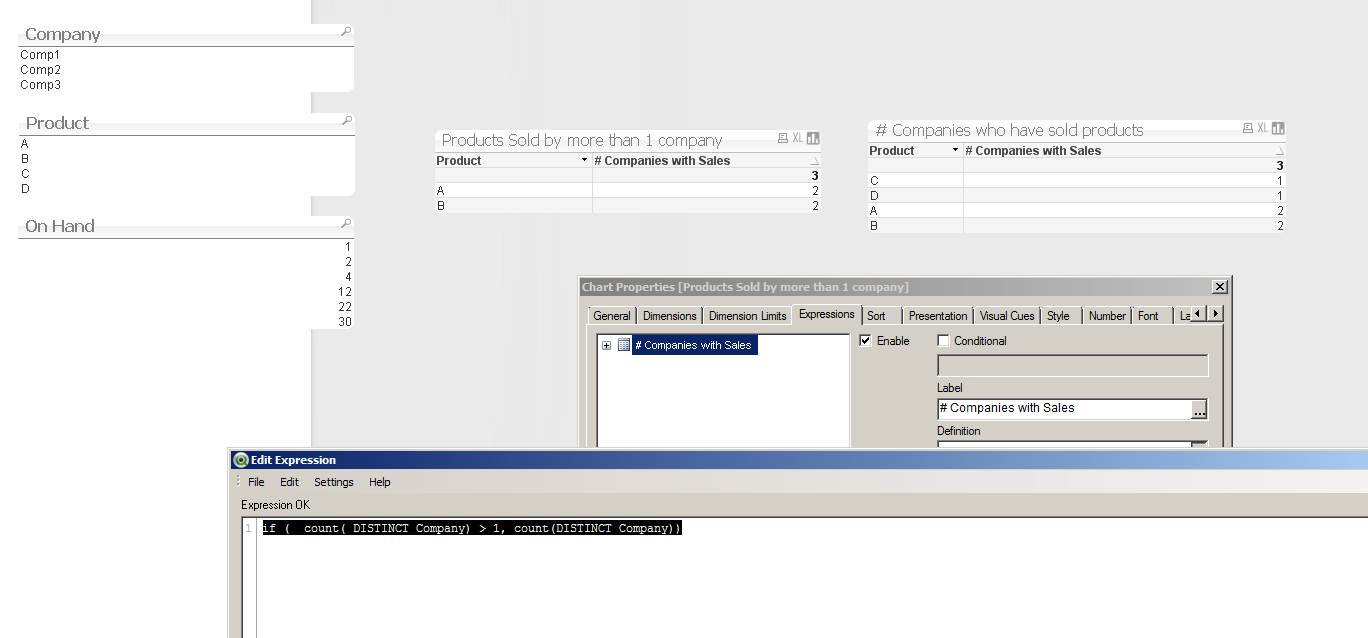
Try this expression in a chart with Product as the dimension
if ( count( DISTINCT Company) > 1, count(DISTINCT Company))
(chart on left i think is what you want)
- Mark as New
- Bookmark
- Subscribe
- Mute
- Subscribe to RSS Feed
- Permalink
- Report Inappropriate Content
Check this
- Mark as New
- Bookmark
- Subscribe
- Mute
- Subscribe to RSS Feed
- Permalink
- Report Inappropriate Content
ok so I guess by both you mean more than 1 company. Jonathan's solution should do it.