Unlock a world of possibilities! Login now and discover the exclusive benefits awaiting you.
- Qlik Community
- :
- All Forums
- :
- QlikView App Dev
- :
- Display second record (max-1) based on selected en...
- Subscribe to RSS Feed
- Mark Topic as New
- Mark Topic as Read
- Float this Topic for Current User
- Bookmark
- Subscribe
- Mute
- Printer Friendly Page
- Mark as New
- Bookmark
- Subscribe
- Mute
- Subscribe to RSS Feed
- Permalink
- Report Inappropriate Content
Display second record (max-1) based on selected end date
Hello,
Sample app and dummy data attached. App Data model is very much on similar lines (UI_EndDate is an island and not Joined/Linked to the fact table).
Scenario: Based on selected end date (Always one selected), display 'Limit' value for 2nd Max Analysis Date (Max [Analysis Date] -1) for rolling 12 month period in fact data.
3 examples to clarify:
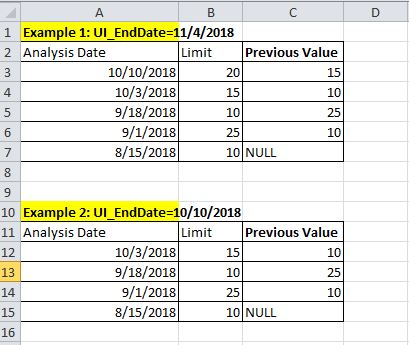
1. If selected UI_EndDate is 11/4/2018, straight table should display below:

2. If selected UI_EndDate is 10/10/2018, straight table should display below:

3. If selected UI_EndDate is 10/1/2018, straight table should display below:
Any help, much appreciated.
Cheers!
- Mark as New
- Bookmark
- Subscribe
- Mute
- Subscribe to RSS Feed
- Permalink
- Report Inappropriate Content
Try this expression :
Sum({<[Analysis Date]={"=Rank(If([Analysis Date]<=UI_EndDate,[Analysis Date]))=2"}>} Limit)
- Mark as New
- Bookmark
- Subscribe
- Mute
- Subscribe to RSS Feed
- Permalink
- Report Inappropriate Content
Hi Tresesco,
Firstly, thanks. Your feedback is accurate based on the question. However, realized I didnot communicate the requirement in its entirety.
Scenario (corrected): Based on selected end date (Always one selected), display 'Limit' value for 2nd Max Analysis Date (Max [Analysis Date] -1) for every record in rolling 12 month period. Re-attaching qvw and sample date.
Expected Output (Column 'Previous Value' needs to be calculated):
Thanks in advance!