Unlock a world of possibilities! Login now and discover the exclusive benefits awaiting you.
- Qlik Community
- :
- All Forums
- :
- QlikView App Dev
- :
- Display the count of a value based on quarterly an...
- Subscribe to RSS Feed
- Mark Topic as New
- Mark Topic as Read
- Float this Topic for Current User
- Bookmark
- Subscribe
- Mute
- Printer Friendly Page
- Mark as New
- Bookmark
- Subscribe
- Mute
- Subscribe to RSS Feed
- Permalink
- Report Inappropriate Content
Display the count of a value based on quarterly and Yearly in bar chart
Hello,
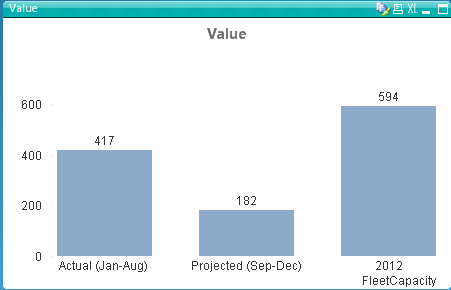
I've a table with different number of fields. Few of them are Prod,DateField. I've entire 2012 data in my table. Now i need to display the count of Prod based on DateField values.
For example:
Actual(Jan to Aug) -> 417
Project(Sep to Dec) -> 182
2012-> 594
But for Year i'm getting 594. I don't know what i'm doing wrong.
The script which i'm using is here:
LET vActual= 'Actual ('&Month(YearStart(Today()))&'-' & Month(AddMonths(Today(),-1))&')';
LET vProjected= 'Projected ('&Month(Today())&'-' & Month(YearEnd(Today()))&')';
LET vCurrentMonth= Month(Today())*1;
LET vCurrentYear= Year(Today());
Table1:
LOAD *,If(Year='$(vCurrentYear)',If(Month(DateField)*1 < $(vCurrentMonth),'$(vActual)','$(vProjected)')) as FleetCapacity;
LOAD DateField,
Year(DateField) as Year,
Month(DateField) as Month,
Production,
FROM
Table1;
CurrentYearProduction:
LOAD Production,If(Year='$(vCurrentYear)','$(vCurrentYear)') as FleetCapacity Resident Table1;
- If i load this script i can able to see in bar chart as show below. For your referenc i'm attaching my sample data file.

Accepted Solutions
- Mark as New
- Bookmark
- Subscribe
- Mute
- Subscribe to RSS Feed
- Permalink
- Report Inappropriate Content
Hello,
If i change the Key field I'm not able to see 2012 in bar chart. To achive this concept i developed below script. It works perfectly.
Table1:
LOAD *,If(Year='$(vCurrentYear)',If(Month(DateField)*1 < $(vCurrentMonth),1,0)) as Flag;
LOAD
DateField,
Year(DateField) as Year,
Month(DateField) as Month,
NoOfShifts,
LPS,
Production,
Type
FROM
Table1;
Dashboard:
LOAD Type,If(Flag=1,Production) as Value,'$(vActual)' as FleetCapacity Resident Table1;
LOAD Type,If(Flag=0,Production) as Value,'$(vProjected)' as FleetCapacity Resident Table1;
LOAD Type,Production as Value,'$(vCurrentYear)' as FleetCapacity Resident Table1;
Thanks for sharing your knowledge.
Cheers!!
Jagan
- Mark as New
- Bookmark
- Subscribe
- Mute
- Subscribe to RSS Feed
- Permalink
- Report Inappropriate Content
The problem is you count a key field.
If you try to create such expression with expression wizard (Paste button) It warns you that you could get unexpected results.
In case you want count, use another field from the corresponding table.
In your case I think you have to add it.
- Mark as New
- Bookmark
- Subscribe
- Mute
- Subscribe to RSS Feed
- Permalink
- Report Inappropriate Content
Hi jagan,
Problem is with thebelow values in procuvtion field
| Production |
| 0 |
| 2160000 |
| 2650000 |
| 6687500 |
| 9822466 |
These values are present in Actual(Jan-Aug),Projected( Sep-Dec ) and also in 2012.Ideally it should be there in Actual(Jan-Aug),Projected(Sep-Dec) only to match with 2012.
Hope it clears you..
- Mark as New
- Bookmark
- Subscribe
- Mute
- Subscribe to RSS Feed
- Permalink
- Report Inappropriate Content
Hello,
If i change the Key field I'm not able to see 2012 in bar chart. To achive this concept i developed below script. It works perfectly.
Table1:
LOAD *,If(Year='$(vCurrentYear)',If(Month(DateField)*1 < $(vCurrentMonth),1,0)) as Flag;
LOAD
DateField,
Year(DateField) as Year,
Month(DateField) as Month,
NoOfShifts,
LPS,
Production,
Type
FROM
Table1;
Dashboard:
LOAD Type,If(Flag=1,Production) as Value,'$(vActual)' as FleetCapacity Resident Table1;
LOAD Type,If(Flag=0,Production) as Value,'$(vProjected)' as FleetCapacity Resident Table1;
LOAD Type,Production as Value,'$(vCurrentYear)' as FleetCapacity Resident Table1;
Thanks for sharing your knowledge.
Cheers!!
Jagan
- Mark as New
- Bookmark
- Subscribe
- Mute
- Subscribe to RSS Feed
- Permalink
- Report Inappropriate Content
Simple solution:
In qlikview 10 we have DimensionLimits Tab-> Check Restrict.....box -> Options -> Show Total and give the label name 2012.
But it will not work for pie chart and few of other charts.
Cheers!!
Jagan