Unlock a world of possibilities! Login now and discover the exclusive benefits awaiting you.
- Qlik Community
- :
- All Forums
- :
- QlikView App Dev
- :
- Display time in hourly format
- Subscribe to RSS Feed
- Mark Topic as New
- Mark Topic as Read
- Float this Topic for Current User
- Bookmark
- Subscribe
- Mute
- Printer Friendly Page
- Mark as New
- Bookmark
- Subscribe
- Mute
- Subscribe to RSS Feed
- Permalink
- Report Inappropriate Content
Display time in hourly format
Hi All
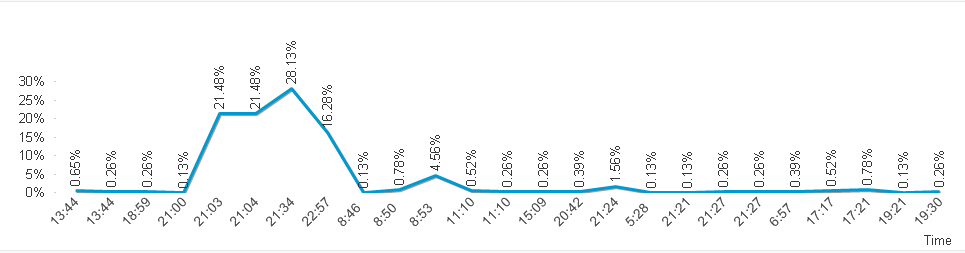
Please assist i need to display time in below graph to be hourly e.g 8:00,9:00,10:00,11:00,12:00,13:00?
Thanks
- « Previous Replies
-
- 1
- 2
- Next Replies »
Accepted Solutions
- Mark as New
- Bookmark
- Subscribe
- Mute
- Subscribe to RSS Feed
- Permalink
- Report Inappropriate Content
Is it that important for the OP to see :00. If it is, then i would just use this instead of making the field text
Time(Floor(grab_time, 1/24), 'h:mm')
- Mark as New
- Bookmark
- Subscribe
- Mute
- Subscribe to RSS Feed
- Permalink
- Report Inappropriate Content
May be attach to test?
- Mark as New
- Bookmark
- Subscribe
- Mute
- Subscribe to RSS Feed
- Permalink
- Report Inappropriate Content
=floor('Time field') in the dimension use it
- Mark as New
- Bookmark
- Subscribe
- Mute
- Subscribe to RSS Feed
- Permalink
- Report Inappropriate Content
Hi Anil
Thank for your quick response below is format of my time?let me know if you need more info.
| 20:49:25 |
| 20:50:25 |
| 11:53:39 |
| 12:07:56 |
| 12:47:46 |
| 12:51:37 |
| 18:51:42 |
| 11:35:37 |
| 09:16:42 |
| 10:10:57 |
| 10:38:36 |
| 14:00:03 |
| 14:00:08 |
| 13:50:53 |
| 08:33:10 |
| 16:58:32 |
| 17:37:56 |
| 16:13:16 |
| 17:34:26 |
| 17:35:21 |
| 11:35:41 |
| 15:33:21 |
| 16:18:14 |
| 16:22:44 |
| 18:10:32 |
| 18:10:35 |
| 18:10:36 |
| 18:16:09 |
- Mark as New
- Bookmark
- Subscribe
- Mute
- Subscribe to RSS Feed
- Permalink
- Report Inappropriate Content
If possible, Please attach QVW that may demon the issue
- Mark as New
- Bookmark
- Subscribe
- Mute
- Subscribe to RSS Feed
- Permalink
- Report Inappropriate Content
Hi Mahesh
Thanks,
After applying what you suggested my graph went blank. my Time field is grab_time.
i used below in my dimension
=floor('grab_time')
- Mark as New
- Bookmark
- Subscribe
- Mute
- Subscribe to RSS Feed
- Permalink
- Report Inappropriate Content
check here same requirement matching here
- Mark as New
- Bookmark
- Subscribe
- Mute
- Subscribe to RSS Feed
- Permalink
- Report Inappropriate Content
Have you tried Hour() function in your dimension?
Hour([grab_time])
- Mark as New
- Bookmark
- Subscribe
- Mute
- Subscribe to RSS Feed
- Permalink
- Report Inappropriate Content
small addition
he want with : 00 so you can this also to sunny answer i think
=hour('Grab_time')&':00'
- Mark as New
- Bookmark
- Subscribe
- Mute
- Subscribe to RSS Feed
- Permalink
- Report Inappropriate Content
Is it that important for the OP to see :00. If it is, then i would just use this instead of making the field text
Time(Floor(grab_time, 1/24), 'h:mm')
- « Previous Replies
-
- 1
- 2
- Next Replies »