Unlock a world of possibilities! Login now and discover the exclusive benefits awaiting you.
- Qlik Community
- :
- All Forums
- :
- QlikView App Dev
- :
- Displaying Change in a Pivot Table
- Subscribe to RSS Feed
- Mark Topic as New
- Mark Topic as Read
- Float this Topic for Current User
- Bookmark
- Subscribe
- Mute
- Printer Friendly Page
- Mark as New
- Bookmark
- Subscribe
- Mute
- Subscribe to RSS Feed
- Permalink
- Report Inappropriate Content
Displaying Change in a Pivot Table
PFA the qlikview file.
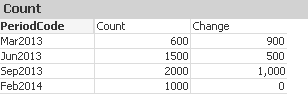
here I want a column called "Change" as follows. Change is basically calculated as Mar2013 -minus June 2013, Sep2013 minus June2013 and so on. Any help would be great.
Mar2013 Change June2013 Change Sep2013 Change Feb2014
600 900 1500 500 2000 -1000 1000
Thanks,
Ram
- « Previous Replies
-
- 1
- 2
- Next Replies »
Accepted Solutions
- Mark as New
- Bookmark
- Subscribe
- Mute
- Subscribe to RSS Feed
- Permalink
- Report Inappropriate Content
See attached a better option.
- Mark as New
- Bookmark
- Subscribe
- Mute
- Subscribe to RSS Feed
- Permalink
- Report Inappropriate Content
Any sequence of this month values
- Mark as New
- Bookmark
- Subscribe
- Mute
- Subscribe to RSS Feed
- Permalink
- Report Inappropriate Content
Hi check below script add another column PickCount for pick above value
A:
load * inline
[
PeriodCode, Count,
Feb2014 ,1000
Sep2013 ,2000
Jun2013 ,1500
Mar2013 ,600
];
LOAD
*,
Peek(Count) as PickCount
Resident A;
DROP Table A;
and in pivot table
Dimension : PeriodCode
Expression1 : Sum(Count)
Expression2 : sum(PickCount) - sum(Count)
Hope this helps
- Mark as New
- Bookmark
- Subscribe
- Mute
- Subscribe to RSS Feed
- Permalink
- Report Inappropriate Content
No. I need a solution in the front end.
Sent from my iPhone
- Mark as New
- Bookmark
- Subscribe
- Mute
- Subscribe to RSS Feed
- Permalink
- Report Inappropriate Content
In straight table you can do like
Dim :- PeriodCode
Expression1 :- Sum(Count)
Expression2 :- Sum(Count) -Above(sum(Count))
Its is necessary that you use only Pivot table let me know.
Hope this helps
- Mark as New
- Bookmark
- Subscribe
- Mute
- Subscribe to RSS Feed
- Permalink
- Report Inappropriate Content
Hello ,
PFA
It gives following output:
- Mark as New
- Bookmark
- Subscribe
- Mute
- Subscribe to RSS Feed
- Permalink
- Report Inappropriate Content
cannot afford do that in a script mate. Thanks anyway.
- Mark as New
- Bookmark
- Subscribe
- Mute
- Subscribe to RSS Feed
- Permalink
- Report Inappropriate Content
thanks Anand. Yes, this has to be a Pivot table unfortunately.
- Mark as New
- Bookmark
- Subscribe
- Mute
- Subscribe to RSS Feed
- Permalink
- Report Inappropriate Content
have you tried previous() ? i only used it in the script, but it might work in frontend expressions too.
f.e. in script
if(previous(item_ID)=[item_ID],
DATA-previous(DATA),-1) as DATA_DIFF,
might work as
if(previous(item_ID)=[item_ID],
DATA-previous(DATA),-1)
or even as
DATA-previous(DATA)
but these kind of functions work better in the script - more performant anyway
- Mark as New
- Bookmark
- Subscribe
- Mute
- Subscribe to RSS Feed
- Permalink
- Report Inappropriate Content
Doing it in the front-end would be a cumbersome work and a kind of static report (not recommended). Using straight table, create one expression for each monthyear like in attached sample.
- « Previous Replies
-
- 1
- 2
- Next Replies »