Unlock a world of possibilities! Login now and discover the exclusive benefits awaiting you.
- Qlik Community
- :
- All Forums
- :
- QlikView App Dev
- :
- Re: Displaying individual records that make up a s...
- Subscribe to RSS Feed
- Mark Topic as New
- Mark Topic as Read
- Float this Topic for Current User
- Bookmark
- Subscribe
- Mute
- Printer Friendly Page
- Mark as New
- Bookmark
- Subscribe
- Mute
- Subscribe to RSS Feed
- Permalink
- Report Inappropriate Content
Displaying individual records that make up a sum in a pivot table
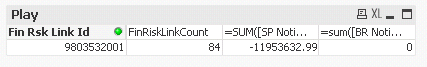
This is a pivot table with Id as dimension, count, and two sum columns... How do I "expand" the 84 records that makes up the sum? I want to see exactly what the 84 records that sum up to 11mil.
- Tags:
- pivot-table
Accepted Solutions
- Mark as New
- Bookmark
- Subscribe
- Mute
- Subscribe to RSS Feed
- Permalink
- Report Inappropriate Content
Hi
I have knocked up the attached sample qvw. It is a bit rough & ready, but should give you inspiration for what you are after - if it is of use & you have any questions regarding it then please ask.
Calculated dimensions can become very inefficient for large data volumes and ideally you should push things back to the load script and make sure you have a goo data model. But no need to worry about that if you only have a small data volume.
Best Regards, Bill
- Mark as New
- Bookmark
- Subscribe
- Mute
- Subscribe to RSS Feed
- Permalink
- Report Inappropriate Content
Hi Bill,
Thanks. Is there a way to sort on the =aggr() calculated dimension?
- Mark as New
- Bookmark
- Subscribe
- Mute
- Subscribe to RSS Feed
- Permalink
- Report Inappropriate Content
Hi
Yup
In Chart Properties | Sort
First deslect all sort on all dimensions.
For the dimension you want in sort order, add the aggr... expression as the expression for Sort by | expression.
Best Regards, Bill