Unlock a world of possibilities! Login now and discover the exclusive benefits awaiting you.
- Qlik Community
- :
- All Forums
- :
- QlikView App Dev
- :
- Re: Distinct Count of non zero records in pivot ta...
- Subscribe to RSS Feed
- Mark Topic as New
- Mark Topic as Read
- Float this Topic for Current User
- Bookmark
- Subscribe
- Mute
- Printer Friendly Page
- Mark as New
- Bookmark
- Subscribe
- Mute
- Subscribe to RSS Feed
- Permalink
- Report Inappropriate Content
Distinct Count of non zero records in pivot table
Hi Community,
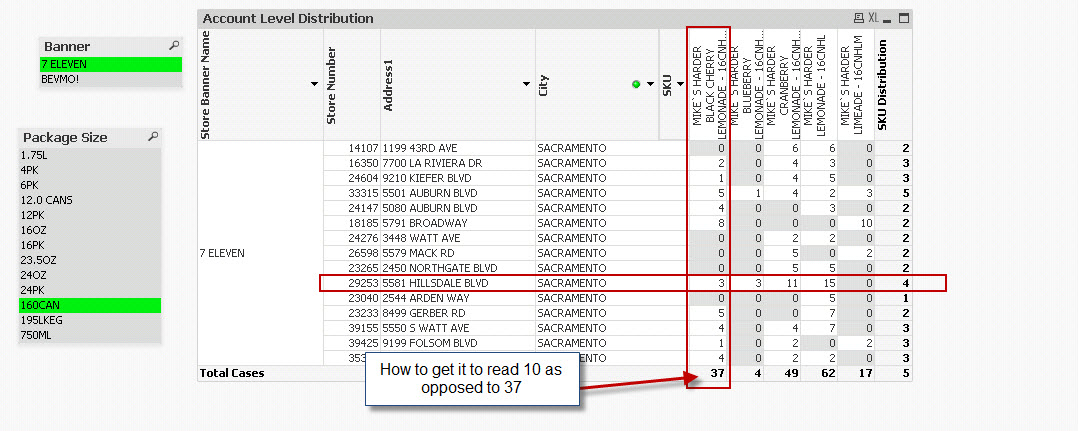
I have a Pivot chart that I need to generate a distinct count of values that are in the VERTICAL columns. I can get the Pivot chart to distinct count across rows but not columns. Has anyone run across this issue before? I have attached a sample qvw. In the image below, you can see that I am successful in counting the number of distinct (non zero) values across rows. I am not able to achieve the same result vertically. What happens is, the chart does a sum across the column as opposed to a distinct count of non zero values.
Accepted Solutions
- Mark as New
- Bookmark
- Subscribe
- Mute
- Subscribe to RSS Feed
- Permalink
- Report Inappropriate Content
You can use Dimensionality() to check for the vertical total line:
=if (SecondaryDimensionality() <> 0,
if(Dimensionality() <>0,
sum({$<Year={$(=Only(Year))}>} Depletion),
count(distinct [Store Number])),
count(distinct {$<Year={$(=Only(Year))}>} if(aggr(sum({$<Year={$(=Only(Year))}>} Depletion),%OutletKey, SKU) > 0, SKU))
)