Unlock a world of possibilities! Login now and discover the exclusive benefits awaiting you.
- Qlik Community
- :
- All Forums
- :
- QlikView App Dev
- :
- Re: Distinct summation
- Subscribe to RSS Feed
- Mark Topic as New
- Mark Topic as Read
- Float this Topic for Current User
- Bookmark
- Subscribe
- Mute
- Printer Friendly Page
- Mark as New
- Bookmark
- Subscribe
- Mute
- Subscribe to RSS Feed
- Permalink
- Report Inappropriate Content
Distinct summation
Hi All,
I have a database with a number of fields, of which the key ones for this question are Customer number, Date & yield. A customer can have a number of entries in this database. I am trying to produce a bar chart for the customer yield by area. The problem I have is that when I do a summation of the yield, I am duplicating, triplicating etc the value of the yield field. I would like to do a summation of the yield field, but based on the last entered value for yield, so that for each distinct customer number, I am only picking up one value of "yield".
Can someone assist with how the expression might look like?
Thank you
Herbert
Accepted Solutions
- Mark as New
- Bookmark
- Subscribe
- Mute
- Subscribe to RSS Feed
- Permalink
- Report Inappropriate Content
sum(aggr(FirstSortedValue([Latest Yield Estimate], -Date), [Customer ID], Area))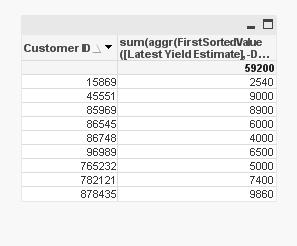
- Mark as New
- Bookmark
- Subscribe
- Mute
- Subscribe to RSS Feed
- Permalink
- Report Inappropriate Content
Can you provide sample excel file or sample apps with little data?
- Mark as New
- Bookmark
- Subscribe
- Mute
- Subscribe to RSS Feed
- Permalink
- Report Inappropriate Content
Hi Manish,
Thanks for the reply. Please find attached a small example I have put together. On the attached data, how would I sum up by area all the latest yield estimates bearing in mind that the customer ID's I have highlighted in green have more than one value, and I only want to add the latest value from each customer.
Many Thanks
Herbert
- Mark as New
- Bookmark
- Subscribe
- Mute
- Subscribe to RSS Feed
- Permalink
- Report Inappropriate Content
Maybe like attached.
Thanks
AJ
- Mark as New
- Bookmark
- Subscribe
- Mute
- Subscribe to RSS Feed
- Permalink
- Report Inappropriate Content
sum(aggr(FirstSortedValue([Latest Yield Estimate], -Date), [Customer ID], Area))
- Mark as New
- Bookmark
- Subscribe
- Mute
- Subscribe to RSS Feed
- Permalink
- Report Inappropriate Content
Something like below?
=============================================================
Temp:
Load * Inline
[
Customer ID , Date, Area, Latest Yield Estimate
96989, 01/03/2014, CA, 15000
85969, 01/03/2014, NYC, 20151
45551, 01/03/2014, NYC, 9000
15869, 01/03/2014, LA, 7000
765232, 01/03/2014, NYC, 5000
86545, 02/03/2014, NC, 6000
86748, 03/03/2014, NC, 4000
85969, 04/03/2014, NYC, 8900
15869, 04/03/2014, LA, 2540
878435, 04/03/2014, IN, 9860
782121, 04/03/2014, IN, 7400
96989, 04/03/2014, CA, 6500
];
Join
Load
[Customer ID],
FirstSortedValue([Latest Yield Estimate],-Date) as RequiredSumResult
Resident Temp
Group By [Customer ID];
===================================
Now Create a Bar Chart
Dimension = Area
Expression = SUM(RequiredSumResult)
Hope this helps...
- Mark as New
- Bookmark
- Subscribe
- Mute
- Subscribe to RSS Feed
- Permalink
- Report Inappropriate Content
Thanks Massimo,
This works perfectly. I like the solution, because it works with my current data without having to go back and redo load statements etc.
Much appreciated.
Herbiec