Unlock a world of possibilities! Login now and discover the exclusive benefits awaiting you.
Announcements
April 13–15 - Dare to Unleash a New Professional You at Qlik Connect 2026: Register Now!
- Qlik Community
- :
- All Forums
- :
- QlikView App Dev
- :
- Re: Distribution Chart
Options
- Subscribe to RSS Feed
- Mark Topic as New
- Mark Topic as Read
- Float this Topic for Current User
- Bookmark
- Subscribe
- Mute
- Printer Friendly Page
Turn on suggestions
Auto-suggest helps you quickly narrow down your search results by suggesting possible matches as you type.
Showing results for
Not applicable
2014-11-25
09:37 AM
- Mark as New
- Bookmark
- Subscribe
- Mute
- Subscribe to RSS Feed
- Permalink
- Report Inappropriate Content
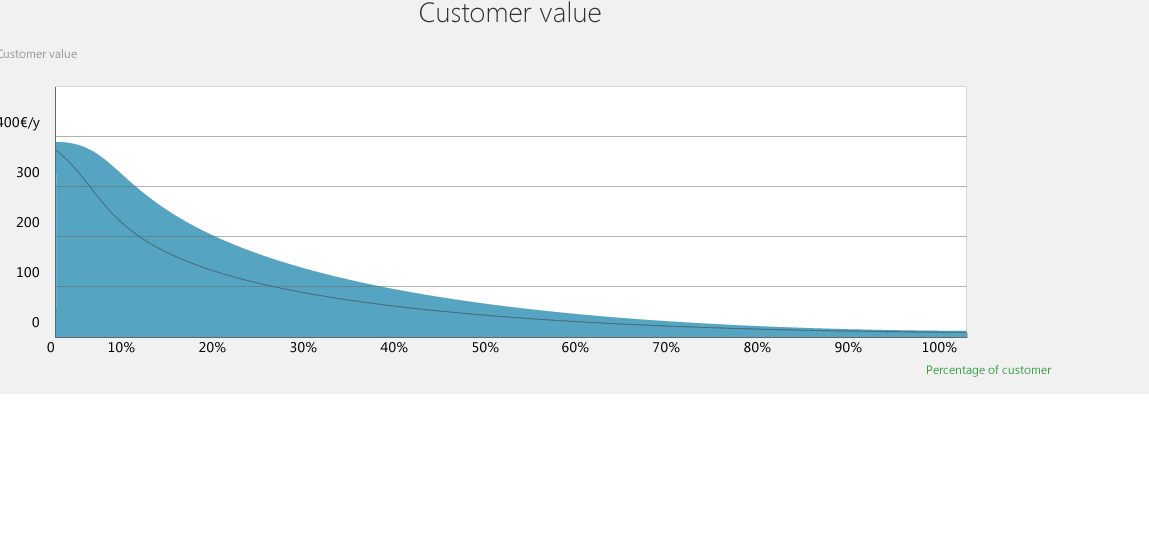
Distribution Chart
We would like to make a graph in which is shown on the x -axis the % of customers and on the Y axis the total amount of sales.
Can somebody help me how we can create this graph?
Regards,
Liselotte
519 Views
2 Replies
MVP
2014-11-26
04:49 PM
- Mark as New
- Bookmark
- Subscribe
- Mute
- Subscribe to RSS Feed
- Permalink
- Report Inappropriate Content
Hi,
looks like some calculated dimension using the aggr() function.
can you post some sample data and expected result?
thanks
regards
Marco
400 Views
Not applicable
2014-11-28
03:21 AM
Author
- Mark as New
- Bookmark
- Subscribe
- Mute
- Subscribe to RSS Feed
- Permalink
- Report Inappropriate Content
Hi Marco,
I don't know how I can include an example except for pictures and videos
But the data includes customID like <123456789> and Sales <49.99>
Kind of
<123456789> <49.99>
<123456756> <99.99>
etc for about 65000 records.
Expected results is the graph mentioned above.
400 Views