Unlock a world of possibilities! Login now and discover the exclusive benefits awaiting you.
- Qlik Community
- :
- All Forums
- :
- QlikView App Dev
- :
- Re: Distribution Graph
- Subscribe to RSS Feed
- Mark Topic as New
- Mark Topic as Read
- Float this Topic for Current User
- Bookmark
- Subscribe
- Mute
- Printer Friendly Page
- Mark as New
- Bookmark
- Subscribe
- Mute
- Subscribe to RSS Feed
- Permalink
- Report Inappropriate Content
Distribution Graph
Hi All,
I have sales data that I would like to prepare a distribution graph from. So I can prepare a distribution graph for sales within certain constant bands by creating a calculated dimension.
However, is it possible to have say sales in the following bands 0-500, 5001-1000, 1001-1500 and then the last group being sales above 1500. My problem is how to create this last group i.e. no. of clients above a certain sales value as the last bar.
So far I can only create a distribution graph based on constant bands. How do I have a certain number of bands and the last band being all sales above the last band?
Hope this makes sense.
Thanks
H
Accepted Solutions
- Mark as New
- Bookmark
- Subscribe
- Mute
- Subscribe to RSS Feed
- Permalink
- Report Inappropriate Content
for example like this:
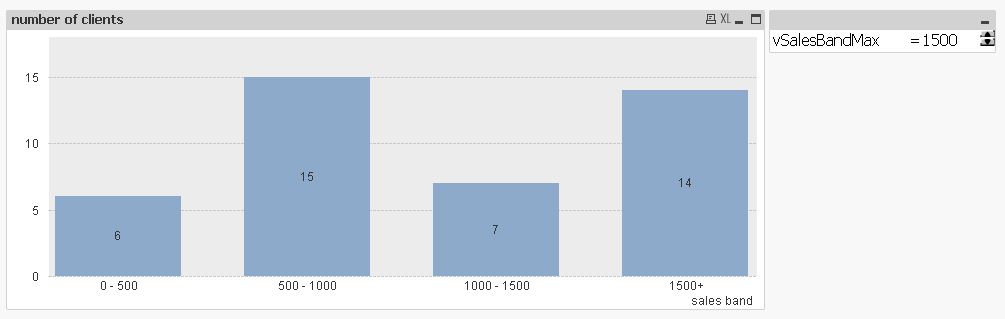
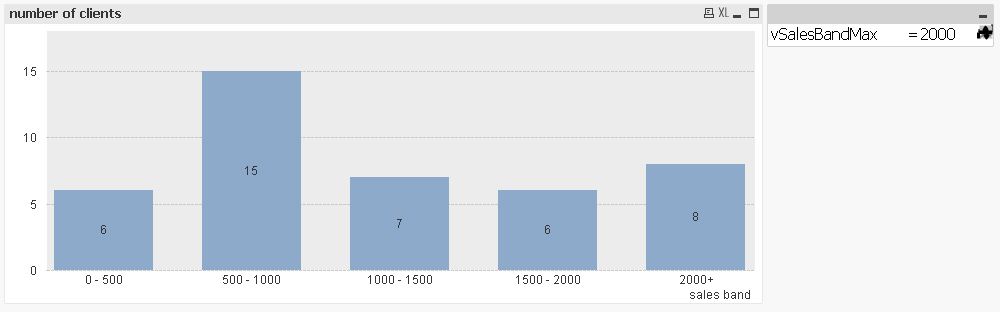
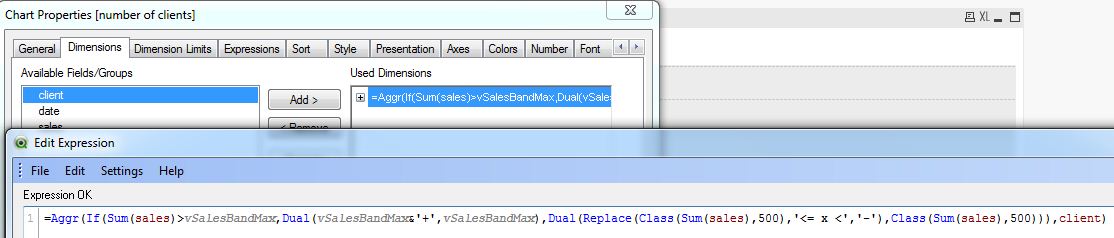
=Aggr(If(Sum(sales)>vSalesBandMax,Dual(vSalesBandMax&'+',vSalesBandMax),Dual(Replace(Class(Sum(sales),500),'<= x <','-'),Class(Sum(sales),500))),client)
given this data:
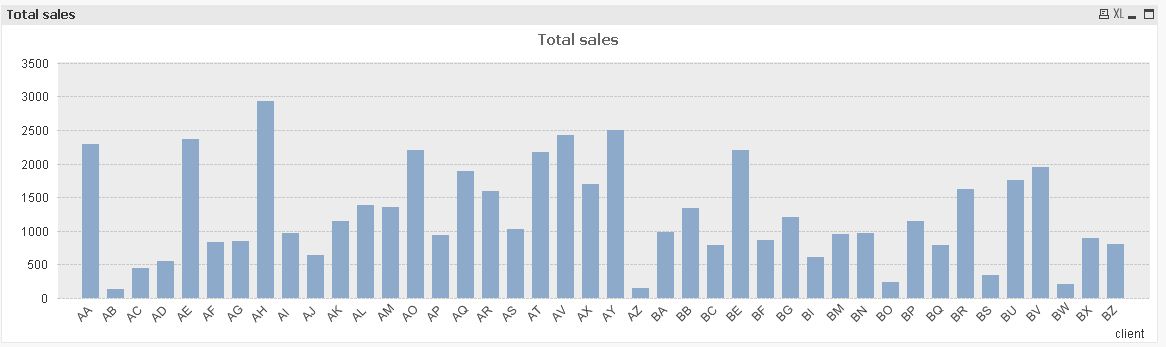
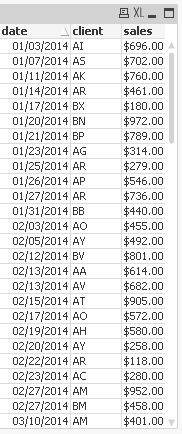
tabSales:
LOAD Date(YearStart(Today())+Floor(Rand()*DayNumberOfYear(Today()))) as date,
     Chr(65+Floor(Rand()*2))&Chr(65+Floor(Rand()*26)) as client,
     Money(Ceil(Rand()*1000)) as sales
AutoGenerate 100;
hope this helps
regards
Marco
- Mark as New
- Bookmark
- Subscribe
- Mute
- Subscribe to RSS Feed
- Permalink
- Report Inappropriate Content
See an example
- Mark as New
- Bookmark
- Subscribe
- Mute
- Subscribe to RSS Feed
- Permalink
- Report Inappropriate Content
you could use an if()/class() combination.
- Mark as New
- Bookmark
- Subscribe
- Mute
- Subscribe to RSS Feed
- Permalink
- Report Inappropriate Content
for example like this:
=Aggr(If(Sum(sales)>vSalesBandMax,Dual(vSalesBandMax&'+',vSalesBandMax),Dual(Replace(Class(Sum(sales),500),'<= x <','-'),Class(Sum(sales),500))),client)
given this data:
tabSales:
LOAD Date(YearStart(Today())+Floor(Rand()*DayNumberOfYear(Today()))) as date,
     Chr(65+Floor(Rand()*2))&Chr(65+Floor(Rand()*26)) as client,
     Money(Ceil(Rand()*1000)) as sales
AutoGenerate 100;
hope this helps
regards
Marco
- Mark as New
- Bookmark
- Subscribe
- Mute
- Subscribe to RSS Feed
- Permalink
- Report Inappropriate Content
Hi Marco,
This is brilliant, exactly what I was looking for. Just one last quick question.
I have another field in my data which which tells me the type of business i.e. "New Business" or "Existing". How would I adjust the calculated condition if I wanted to look at purely the "New Business?
Many Thanks
H
- Mark as New
- Bookmark
- Subscribe
- Mute
- Subscribe to RSS Feed
- Permalink
- Report Inappropriate Content
You could add a set expression like {$<fieldname={'New Business'}>}
in the sum function.
Please mark correct and/or helpful answers if your initial question is answered.
Hope this helps
Regards
Marco
- Mark as New
- Bookmark
- Subscribe
- Mute
- Subscribe to RSS Feed
- Permalink
- Report Inappropriate Content
Thank you very very much, really appreciate your help.
- Mark as New
- Bookmark
- Subscribe
- Mute
- Subscribe to RSS Feed
- Permalink
- Report Inappropriate Content
You're welcome
Regards
Marco