Unlock a world of possibilities! Login now and discover the exclusive benefits awaiting you.
- Qlik Community
- :
- All Forums
- :
- QlikView App Dev
- :
- Do While loop
- Subscribe to RSS Feed
- Mark Topic as New
- Mark Topic as Read
- Float this Topic for Current User
- Bookmark
- Subscribe
- Mute
- Printer Friendly Page
- Mark as New
- Bookmark
- Subscribe
- Mute
- Subscribe to RSS Feed
- Permalink
- Report Inappropriate Content
Do While loop
I have ship dates that the user can select and as they select it changes the values of another field in a chart. The goal is for this field value to be equal or greater than another value, which is calculated. The user has requested that I automate this process so when the calculated field value is set, the ship dates are advanced until the chart field is equal to or just greater than the calculated field. Can anyone assist me with the script that would do this?
Message was edited by: James Walsh
- « Previous Replies
- Next Replies »
- Mark as New
- Bookmark
- Subscribe
- Mute
- Subscribe to RSS Feed
- Permalink
- Report Inappropriate Content
A sample would help. Can u share a QVW ?
- Mark as New
- Bookmark
- Subscribe
- Mute
- Subscribe to RSS Feed
- Permalink
- Report Inappropriate Content
How do I share it? Is it as simple as copy and paste?
James F. Walsh Jr.
MIS
ME Elecmetal
(218) 213-9571
- Mark as New
- Bookmark
- Subscribe
- Mute
- Subscribe to RSS Feed
- Permalink
- Report Inappropriate Content
In your reply , go into the 'advanced editor' and from there you can attach a file.
- Mark as New
- Bookmark
- Subscribe
- Mute
- Subscribe to RSS Feed
- Permalink
- Report Inappropriate Content
When I go into my message and select reply, I do not see an "Advanced
Editor"?
James F. Walsh Jr.
MIS
ME Elecmetal
(218) 213-9571
- Mark as New
- Bookmark
- Subscribe
- Mute
- Subscribe to RSS Feed
- Permalink
- Report Inappropriate Content
I thought I figured out how to attach but I do not see it?
- Mark as New
- Bookmark
- Subscribe
- Mute
- Subscribe to RSS Feed
- Permalink
- Report Inappropriate Content
It is attached to the original entry.
- Mark as New
- Bookmark
- Subscribe
- Mute
- Subscribe to RSS Feed
- Permalink
- Report Inappropriate Content
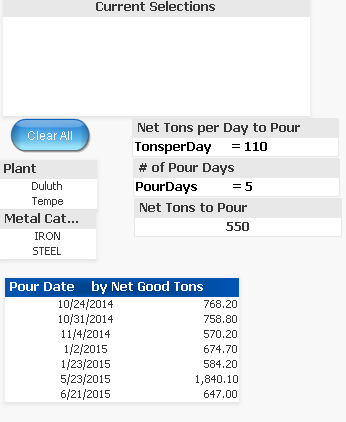
"Net Tons to Pour", based on user values for "Net Tons per Day to Pour" and "# of Pour Days", is calculated and when "Net Good Tons" is equal to or greater than "Net Tons to Pour", "Pour Date" selection should stop. Currently, once I have a value for "Net Tons to Pour", I start selecting "Pour Date" and guess when "Net Good Tons" might be close to "Net Tons to Pour". The user has asked if I can automate this so once "Net Tons to Pour" is calculated, "Pour Date"s are selected until "Net Good Tons" is no long less than "Net Tons to Pour".
- Mark as New
- Bookmark
- Subscribe
- Mute
- Subscribe to RSS Feed
- Permalink
- Report Inappropriate Content
I changed the 'Pour Date' list box to an expression;
=if ( (TonsperDay*PourDays) <= aggr( Sum ((([Each Weight])/2000)*[To Pour Qty.]), [Pour Date]), [Pour Date])
It means that [Pour Date] will only show if 'Net Tons to Pour' is less than or equal to 'Net Good Tons'
I also added a list box expression whic shows 'net good tons' so the user has an idea of the threshold and what further filtering may yield.
also attached is the QVW sample. Did i get this right ? I couldn't be 100% after reading your explanation. ! !
- Mark as New
- Bookmark
- Subscribe
- Mute
- Subscribe to RSS Feed
- Permalink
- Report Inappropriate Content
But I still need to show Net Good Tons broken out by Metal Type (Alloy). Do I need to add the Pour Date expression to my to charts that are already on the page?
- « Previous Replies
- Next Replies »